There Are 6.56 Million B2B Decision Makers in the US; Professional, Scientific, and Technical Services Employs the Most
How many B2B decision makers are in the US, by industry. Published October 2026.
Hollerly analysis of BLS Occupational Employment and Wage Statistics, May 2025
Key findings
- There are 6,556,950 B2B decision makers in the US across eight management occupations, 4.2% of all wage and salary jobs.
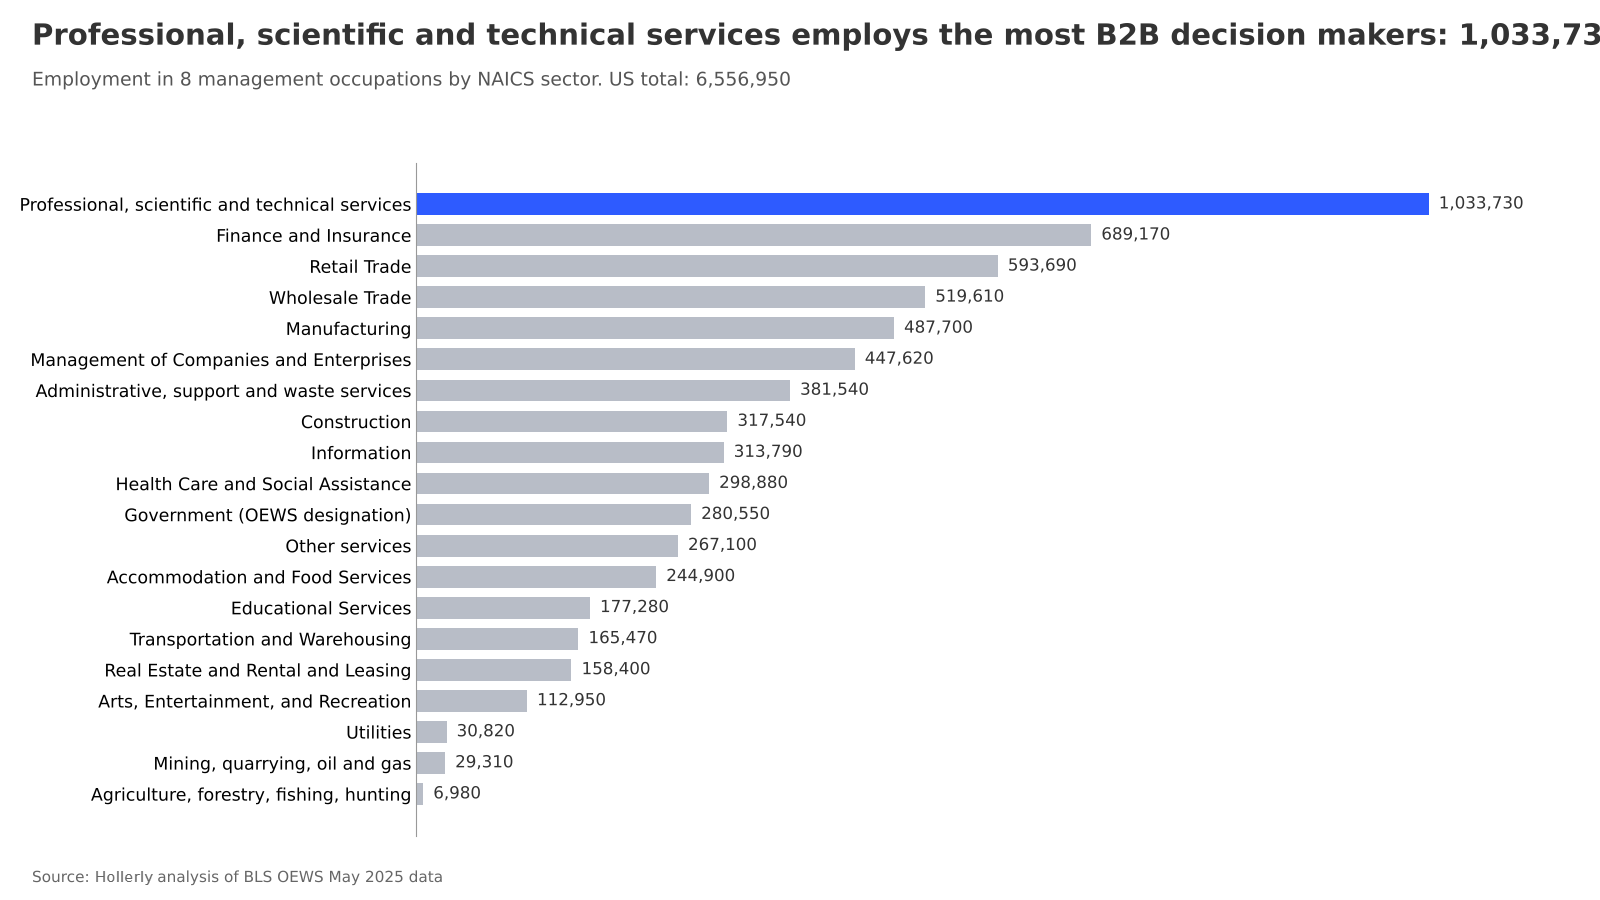
- Professional, scientific and technical services employs the most decision makers of any sector, 1,033,730.
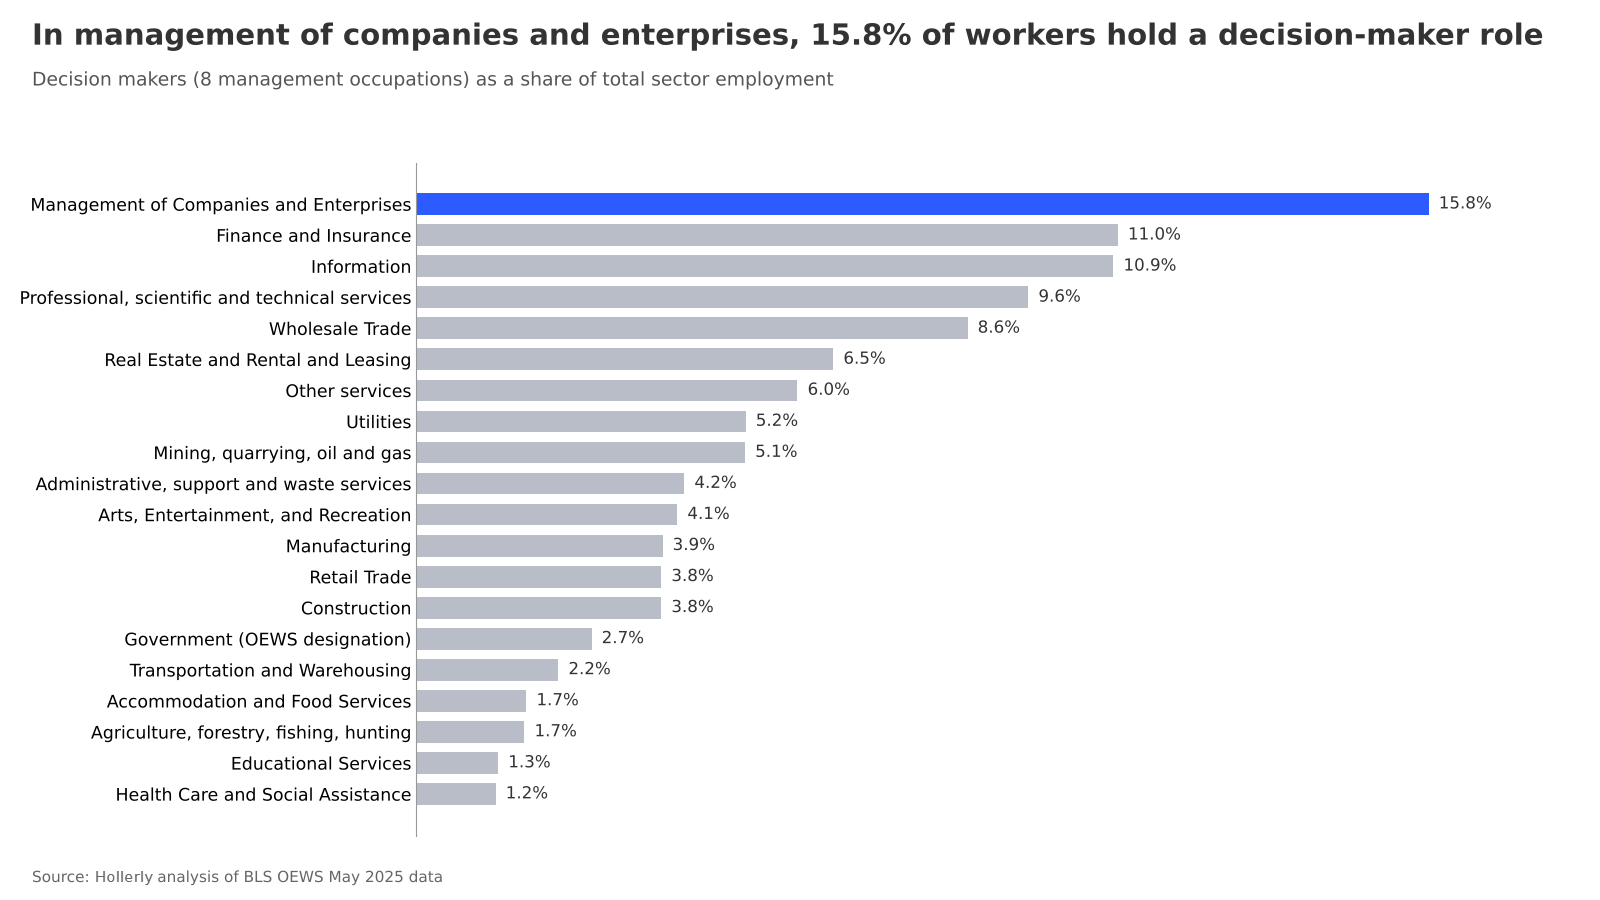
- Management of Companies and Enterprises has the highest concentration: 15.8% of the sector's workers are in one of the eight decision-maker roles.
- Decision makers in management of companies and enterprises earn the highest average wage of any sector, $204,638.
- Excluding CEOs and general managers, there are 2,849,580 functional leaders (marketing, sales, IT, finance, purchasing and HR managers) in the US.
- Professional, scientific and technical services employs the most functional leaders, 554,830.
- The average decision maker across the eight occupations earns $158,361 a year.
How big is the B2B buyer pool
Anyone sizing a B2B market eventually asks how many people actually sign off on purchases. Federal wage data gives a defensible floor. In May 2025, US employers reported 6,556,950 people working in eight management occupations that typically hold budget authority: chief executives, general and operations managers, and the heads of marketing, sales, IT, finance, purchasing and HR.
That is 4.2% of the 155,495,730 wage and salary jobs BLS counts.
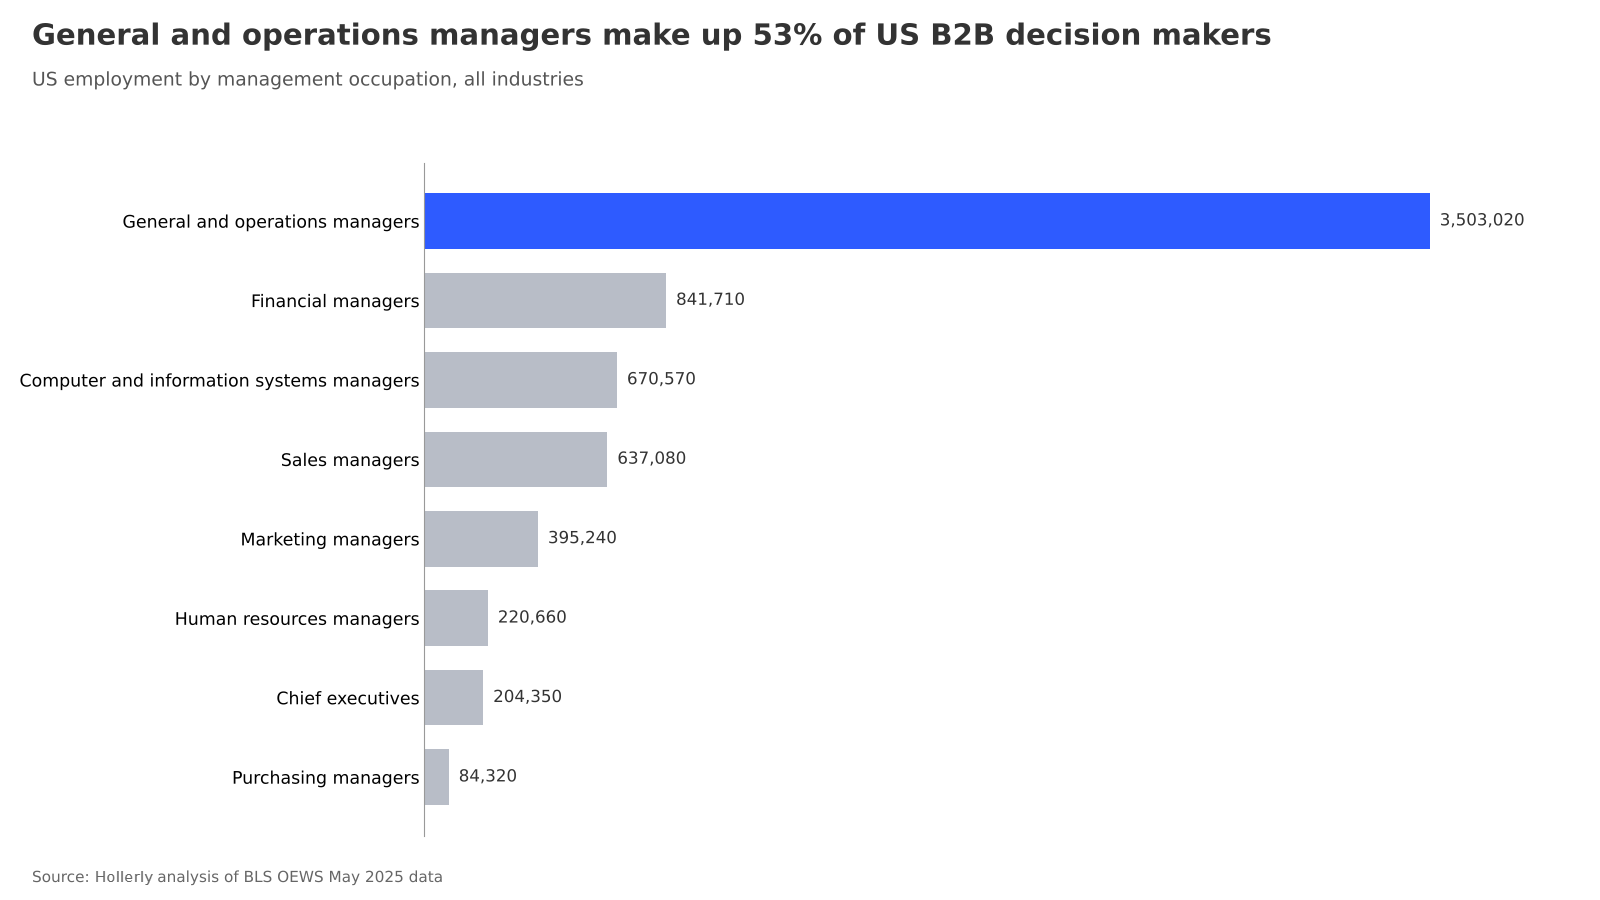
General and operations managers are the largest group by far, at 3,503,020. Strip out CEOs and general managers and 2,849,580 functional leaders remain, the people who usually own a department budget.
| SOC | Occupation | US employment | Mean wage | Median wage |
|---|---|---|---|---|
| 11-1021 | General and Operations Managers | 3,503,020 | $134,940 | $105,770 |
| 11-3031 | Financial Managers | 841,710 | $186,910 | $166,570 |
| 11-3021 | Computer and Information Systems Managers | 670,570 | $192,160 | $175,140 |
| 11-2022 | Sales Managers | 637,080 | $164,350 | $148,270 |
| 11-2021 | Marketing Managers | 395,240 | $177,770 | $166,790 |
| 11-3121 | Human Resources Managers | 220,660 | $164,230 | $149,280 |
| 11-1011 | Chief Executives | 204,350 | $269,630 | $213,990 |
| 11-3061 | Purchasing Managers | 84,320 | $156,360 | $148,080 |
Which sectors employ the most decision makers
Professional, scientific and technical services leads with 1,033,730 decision makers, followed by finance and insurance (689,170) and retail trade (593,690).
Where decision makers are most concentrated
Raw counts favor big sectors. Concentration tells a different story. In management of companies and enterprises, 15.8% of workers hold one of these eight roles, compared with 1.2% in health care and social assistance.
Full sector table
| Sector | Decision makers | Share of sector jobs | Mean wage |
|---|---|---|---|
| Professional, scientific and technical services | 1,033,730 | 9.6% | $186,572 |
| Finance and Insurance | 689,170 | 11.0% | $194,703 |
| Retail Trade | 593,690 | 3.8% | $104,753 |
| Wholesale Trade | 519,610 | 8.6% | $160,357 |
| Manufacturing | 487,700 | 3.9% | $165,426 |
| Management of Companies and Enterprises | 447,620 | 15.8% | $204,638 |
| Administrative, support and waste services | 381,540 | 4.2% | $141,757 |
| Construction | 317,540 | 3.8% | $138,337 |
| Information | 313,790 | 10.9% | $197,799 |
| Health Care and Social Assistance | 298,880 | 1.2% | $141,300 |
| Government (OEWS designation) | 280,550 | 2.7% | $143,940 |
| Other services | 267,100 | 6.0% | $122,408 |
| Accommodation and Food Services | 244,900 | 1.7% | $85,890 |
| Educational Services | 177,280 | 1.3% | $146,597 |
| Transportation and Warehousing | 165,470 | 2.2% | $135,858 |
| Real Estate and Rental and Leasing | 158,400 | 6.5% | $142,243 |
| Arts, Entertainment, and Recreation | 112,950 | 4.1% | $122,099 |
| Utilities | 30,820 | 5.2% | $179,461 |
| Mining, quarrying, oil and gas | 29,310 | 5.1% | $188,363 |
| Agriculture, forestry, fishing, hunting | 6,980 | 1.7% | $112,874 |
To reach these buyers directly, Hollerly's LinkedIn prospecting software finds the right people on LinkedIn and writes each first message with AI.
About the data
- Source: U.S. Bureau of Labor Statistics, Occupational Employment and Wage Statistics (OEWS), May 2025, the latest release available as of 2026-10-02. National sector-level industry estimates (20 NAICS sectors, including the OEWS government designation) and national cross-industry estimates.
- Definition of B2B decision makers: employment in eight SOC occupations: 11-1011 Chief Executives, 11-1021 General and Operations Managers, 11-2021 Marketing Managers, 11-2022 Sales Managers, 11-3021 Computer and Information Systems Managers, 11-3031 Financial Managers, 11-3061 Purchasing Managers and 11-3121 Human Resources Managers. "Functional leaders" excludes the first two.
- Calculation: counts are summed per sector. Share of workforce divides by total sector employment (SOC 00-0000). Mean wage is the employment-weighted average of published occupation mean wages. The national total comes from the cross-industry file; the sum of the 20 sector rows is 6,557,030, a difference due to rounding in published estimates.
- Suppressed cells: all employment cells were published. 2 sector wage averages omit one suppressed wage cell: Government (OEWS designation) (Sales managers (930 jobs)); Real Estate and Rental and Leasing (Chief executives (5,940 jobs)).
- Limitations: OEWS counts wage and salary jobs and excludes self-employed owners, so small business owners who make purchasing decisions are not counted. Job titles and buying authority vary by company; this is an occupational proxy for the buyer pool, not a contact count. Government and educational services include public employers.
Sources
- BLS OEWS May 2025, national industry-specific estimates: bls.gov/oes/special-requests/oesm25in4.zip
- BLS OEWS May 2025, national estimates: bls.gov/oes/special-requests/oesm25nat.zip
- OEWS data tables index: bls.gov/oes/tables.htm
Source: Hollerly, How many B2B decision makers are in the US, by industry, October 2026. https://hollerlyai.com/research/b2b-decision-makers-by-industry
Charts and data are free to use under CC BY 4.0 with a link to this page. Press questions: hello@hollerlyai.com