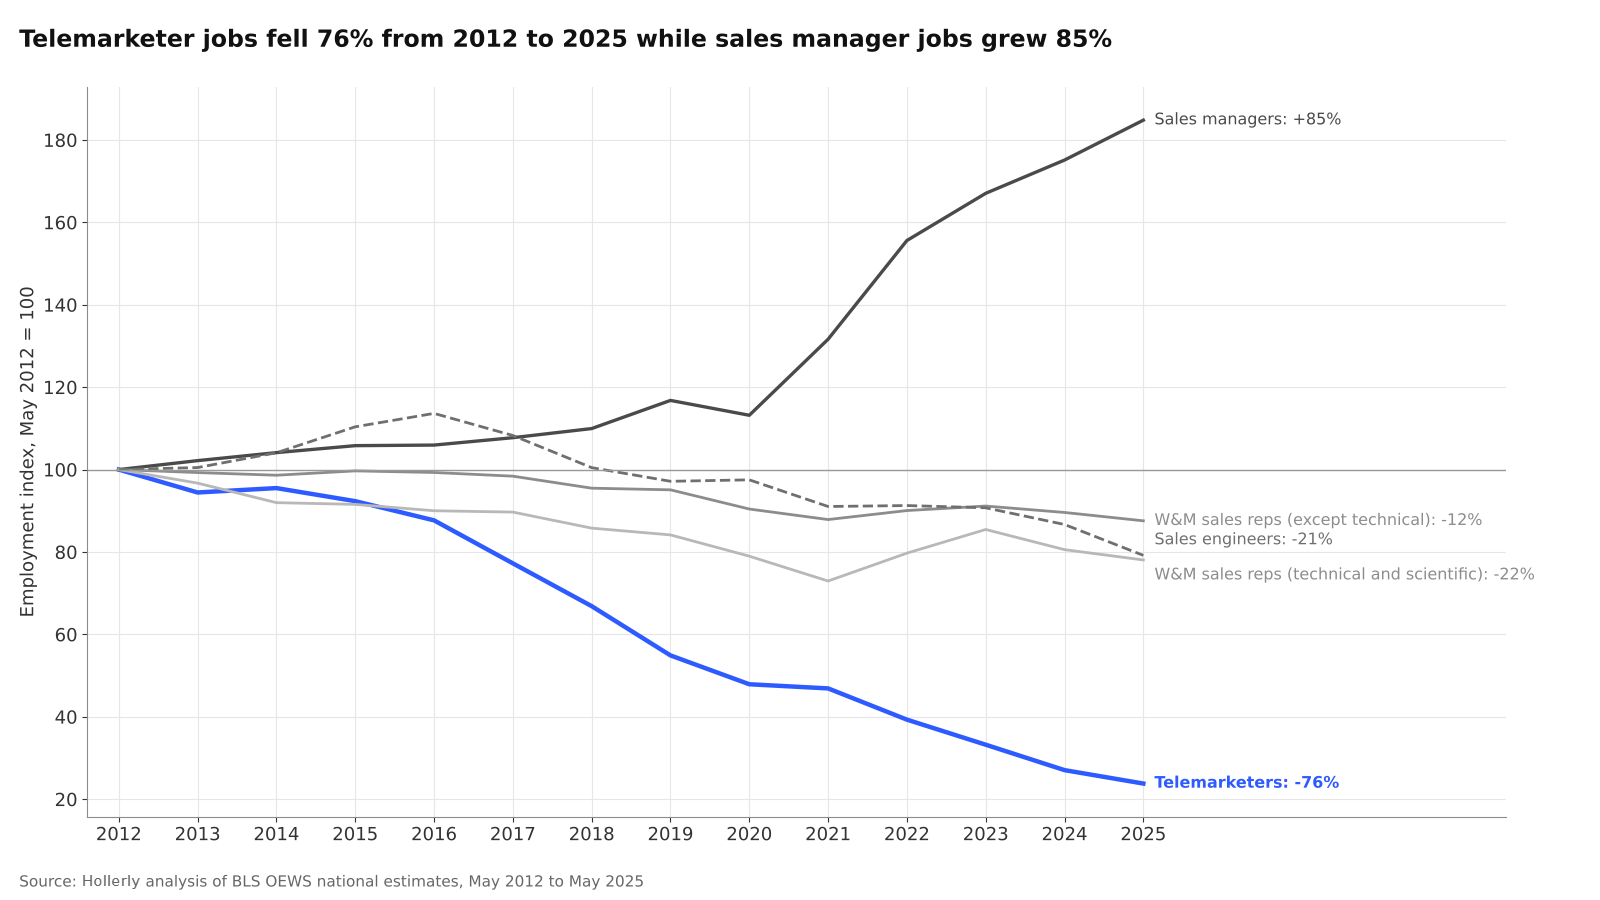
Telemarketer jobs fell 76% from 2012 to 2025 while sales manager jobs grew 85%
Telemarketing Jobs vs Other Sales Roles, 2012 to 2025. Published October 2026.
Hollerly analysis of BLS Occupational Employment and Wage Statistics (OEWS), May 2012 to May 2025
Key findings
- US telemarketer employment fell from 245,550 in May 2012 to 58,430 in May 2025, a 76.2% decline.
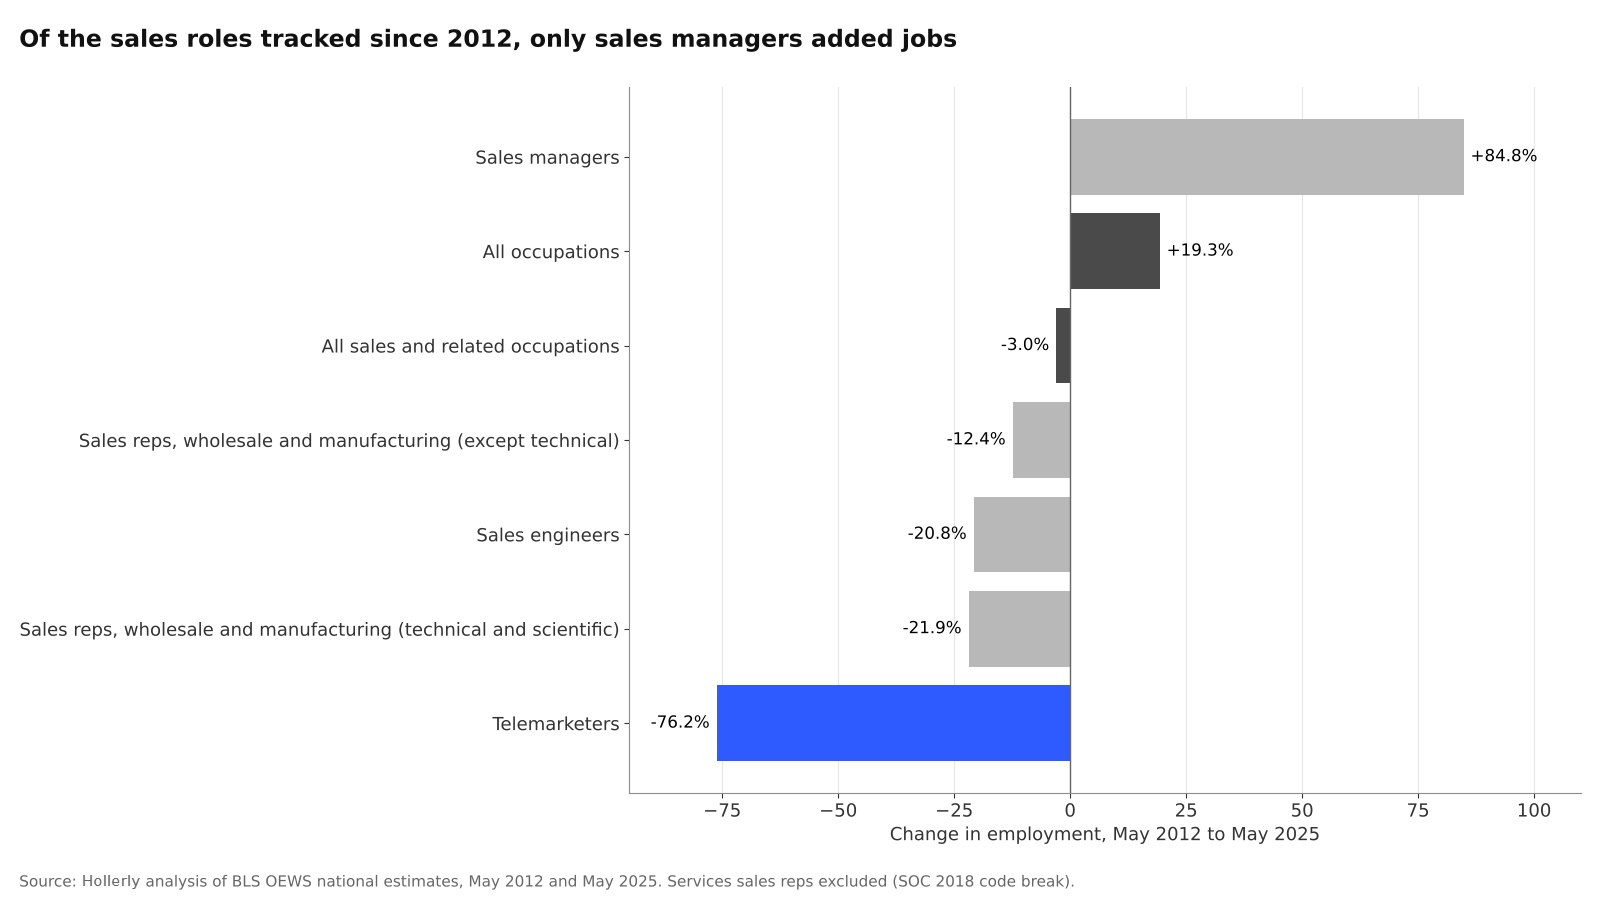
- Sales manager employment grew 84.8% over the same period, from 344,730 to 637,080.
- Telemarketers made up 1.8% of all sales and related jobs in 2012 and 0.4% in 2025.
- Employment of wholesale and manufacturing sales reps for technical and scientific products fell 21.9% between 2012 and 2025, and sales engineer employment fell 20.8%.
- Sales representatives of services grew 20.8% between May 2019 and May 2025, reaching 1,256,010 jobs.
- Total sales and related employment was 3.0% lower in 2025 than in 2012, while employment across all occupations rose 19.3%.
The steady decline of phone-room selling
Telemarketing is the clearest long-run decline in the federal sales occupation data. OEWS counted 245,550 telemarketers in May 2012. By May 2025 the count was 58,430, down 76.2%. The drop was not a single shock: employment fell in 12 of the 13 year-over-year comparisons, and it has continued since 2019 (down 56.7% from May 2019 to May 2025).
The BLS definition matters here. The Telemarketers occupation covers workers who solicit donations or orders for goods or services over the telephone. Sales representatives who use the phone as one part of a broader selling role are classified in the sales representative occupations. So the decline describes a shrinking dedicated-calling occupation, not a measure of how much phone selling happens inside other sales jobs.
Where sales employment moved
Sales manager employment rose 84.8% between 2012 and 2025, with most of the gain after 2020. Services sales reps, a category that includes many sellers of business services, grew 20.8% from 2019 to 2025 under the current SOC code.
Wholesale and manufacturing sales reps, the largest B2B sales occupation by headcount, declined 12.4% (non-technical products) and 21.9% (technical and scientific products). Sales engineers fell 20.8%.
| Occupation | May 2012 | May 2019 | May 2025 | Change 2012 to 2025 | Change 2019 to 2025 |
|---|---|---|---|---|---|
| Telemarketers | 245,550 | 134,800 | 58,430 | -76.2% | -56.7% |
| Sales managers | 344,730 | 402,600 | 637,080 | +84.8% | +58.2% |
| Sales reps, wholesale and manufacturing (except technical) | 1,414,030 | 1,344,530 | 1,238,190 | -12.4% | -7.9% |
| Sales reps, wholesale and manufacturing (technical and scientific) | 364,830 | 306,980 | 284,800 | -21.9% | -7.2% |
| Sales engineers | 65,410 | 63,550 | 51,790 | -20.8% | -18.5% |
| Sales reps of services | 672,080 | 1,039,670 | 1,256,010 | n/a (code change) | +20.8% |
| All sales and related occupations | 13,835,090 | 14,371,410 | 13,424,300 | -3.0% | -6.6% |
| All occupations | 130,287,700 | 146,875,480 | 155,495,730 | +19.3% | +5.9% |
Across the whole sales and related group, employment was 3.0% lower in 2025 than in 2012. Retail salespersons and cashiers alone made up 52.0% of that group in 2025, so the B2B roles above can move differently from the total.
Hollerly's LinkedIn connection bot sends personalized connection requests at a safe daily pace, inside the working hours you set.
About the data
- Source: U.S. Bureau of Labor Statistics, Occupational Employment and Wage Statistics (OEWS), national cross-industry estimates for May 2012 through May 2025 (14 annual releases). May 2025 is the latest release.
- Occupations (SOC): Telemarketers (41-9041), Sales Managers (11-2022), Sales Representatives, Wholesale and Manufacturing, Except Technical and Scientific Products (41-4012), Sales Representatives, Wholesale and Manufacturing, Technical and Scientific Products (41-4011), Sales Engineers (41-9031), services sales reps (41-3099 through 2018, 41-3091 from 2019), all sales and related (41-0000) and all occupations (00-0000).
- Calculation: Percent change in published total employment between survey years.
- Limitations: OEWS estimates pool three years of survey panels, and BLS notes that the program is not designed for year-to-year time series comparison, so long-run changes are more reliable than single-year moves. The 2018 SOC revision replaced "Sales Representatives, Services, All Other" (41-3099) with 41-3091, which has a different scope, so services reps are compared only from 2019. OEWS excludes the self-employed. May 2020 and May 2021 estimates include pandemic-period panels.
Sources
- BLS OEWS national, May 2012: bls.gov/oes/special-requests/oesm12nat.zip
- BLS OEWS national, May 2019: bls.gov/oes/special-requests/oesm19nat.zip
- BLS OEWS national, May 2025: bls.gov/oes/special-requests/oesm25nat.zip
- All 14 annual files (2012 to 2025) are listed in the Sources tab of data.xlsx.
- BLS OEWS FAQ on time-series comparisons: bls.gov/oes/oes_ques.htm
- 2018 SOC crosswalk: bls.gov/soc/2018/crosswalks_used_by_agencies.htm
Source: Hollerly, Telemarketing Jobs vs Other Sales Roles, 2012 to 2025, October 2026. https://hollerlyai.com/research/telemarketing-vs-sales-roles
Charts and data are free to use under CC BY 4.0 with a link to this page. Press questions: hello@hollerlyai.com