The median salesperson has been with their current employer 3.3 years, vs 4.1 years for all workers
How Long Salespeople Stay in Their Jobs. Published October 2026.
Hollerly analysis of BLS Employee Tenure data, January 2008 to January 2026
Key findings
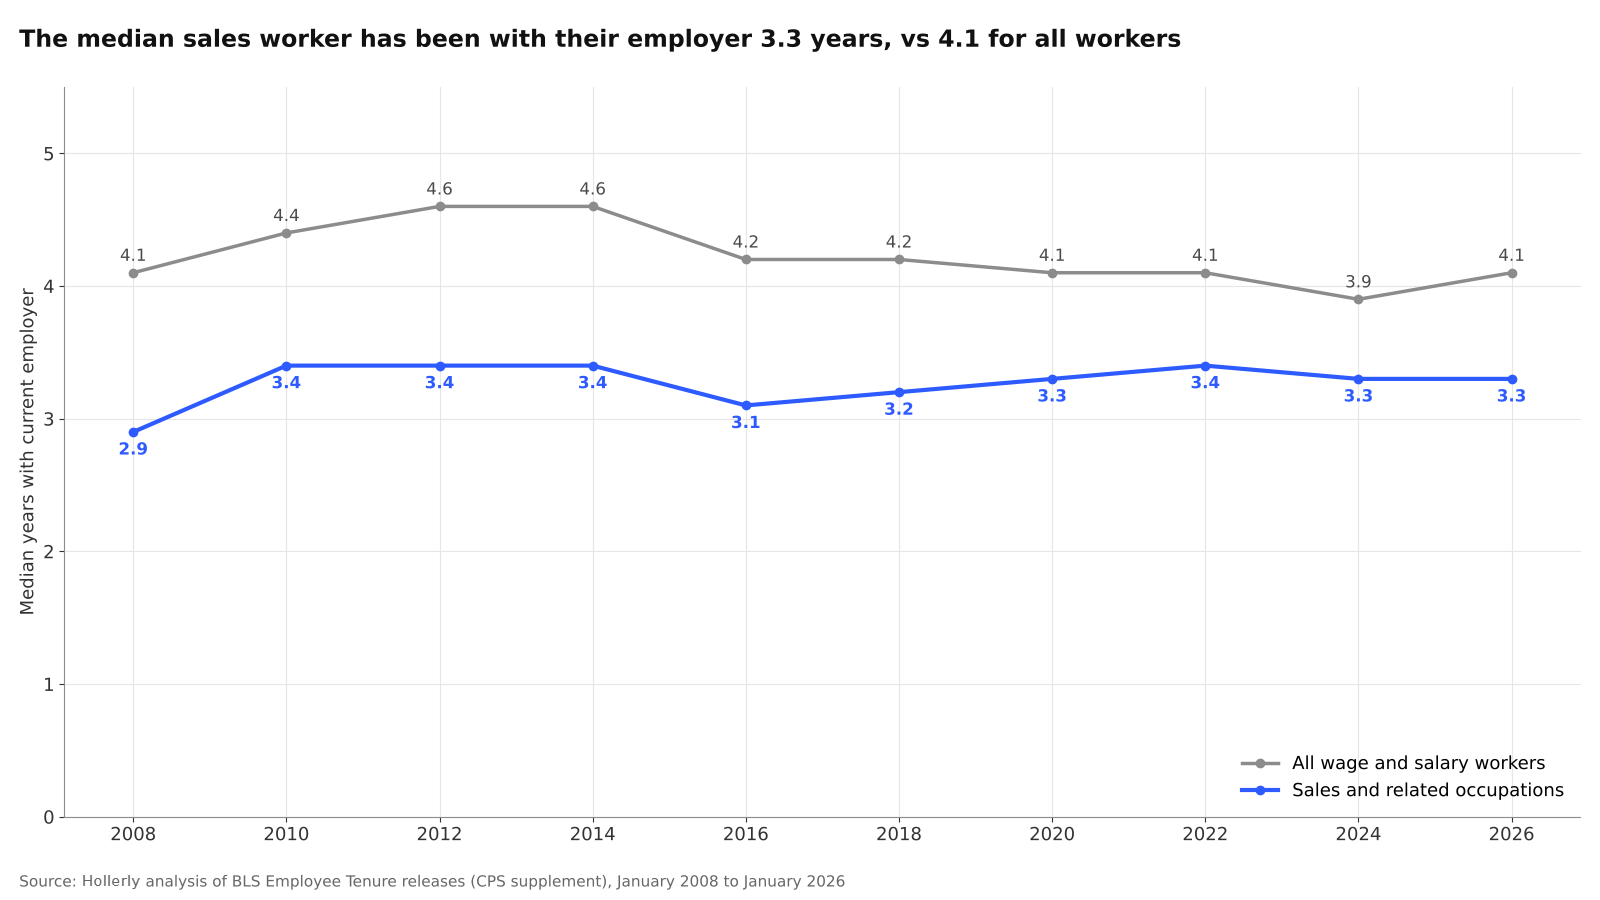
- In January 2026, wage and salary workers in sales and related occupations had a median of 3.3 years with their current employer, compared with 4.1 years for all wage and salary workers.
- Sales ranked 19 of 22 occupation groups for median job tenure in January 2026.
- Median tenure in sales rose from 2.9 years in January 2008 to 3.3 years in January 2026.
- The tenure gap between sales workers and all workers narrowed from 1.2 years in 2008 to 0.8 years in 2026.
- Workers in management occupations had a median tenure of 6.1 years in January 2026, nearly twice the 3.3 years for sales workers.
Sales tenure sits below the national median
The Bureau of Labor Statistics measures job tenure every two years through a supplement to the Current Population Survey. In the latest release (January 2026 data, published September 2026), the median wage and salary worker in a sales occupation had been with their current employer for 3.3 years. Across all wage and salary workers, the median was 4.1 years.
| January | Sales and related | All workers | Difference |
|---|---|---|---|
| 2008 | 2.9 | 4.1 | -1.2 |
| 2010 | 3.4 | 4.4 | -1.0 |
| 2012 | 3.4 | 4.6 | -1.2 |
| 2014 | 3.4 | 4.6 | -1.2 |
| 2016 | 3.1 | 4.2 | -1.1 |
| 2018 | 3.2 | 4.2 | -1.0 |
| 2020 | 3.3 | 4.1 | -0.8 |
| 2022 | 3.4 | 4.1 | -0.7 |
| 2024 | 3.3 | 3.9 | -0.6 |
| 2026 | 3.3 | 4.1 | -0.8 |
Sales tenure has been below the all-worker median in every survey since at least 2008. The gap has narrowed over time, from 1.2 years in 2008 to 0.8 years in 2026, mostly because tenure for sales workers edged up while the overall median moved within a narrow range.
Where sales ranks
Out of 22 occupation groups in the BLS table, sales and related occupations ranked 19 for median tenure in January 2026. Only healthcare support, personal care and service, and food preparation and serving occupations had shorter median tenure.
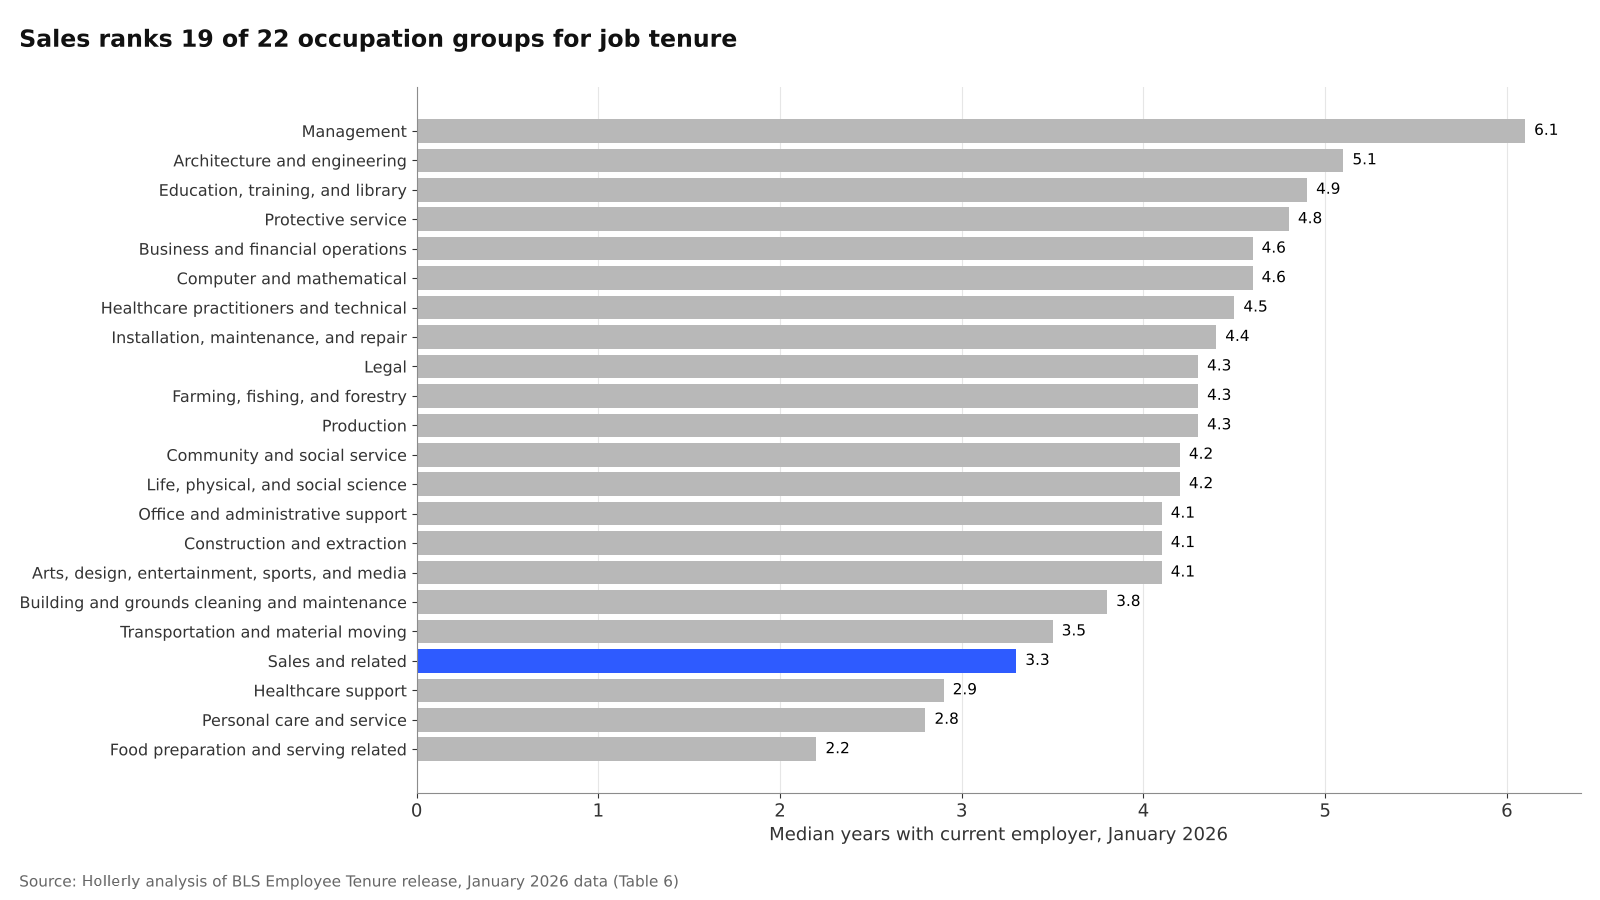
Management occupations had the longest median tenure, at 6.1 years. Business and financial operations workers were at 4.6 years and office and administrative support workers at 4.1 years.
Reading the numbers
Median tenure is not the same as turnover. It measures how long current workers have been with their employer at a point in time, so it is affected by age mix, hiring waves and the number of people who recently changed jobs. The BLS sales group also includes retail sales workers and cashiers, a large share of the group, alongside B2B account executives and sales representatives. The figure describes the whole occupation group, not B2B sales teams alone.
For sales leaders, the practical reading is that the typical person in a sales role today has been with their employer for a little over three years. That is a useful reference point when planning ramp time and territory continuity.
Hollerly's LinkedIn message automation tool writes each message with AI and follows up on LinkedIn and email until someone replies.
About the data
- Source: U.S. Bureau of Labor Statistics, Employee Tenure news releases, Table 6 ("Median years of tenure with current employer for employed wage and salary workers by occupation"). Data from the January 2026 release (published September 24, 2026, covering 2016 to 2026) and the archived September 2018 release (covering 2008 to 2018).
- Sample: Employed wage and salary workers age 16 and over, from the January CPS tenure supplement. Self-employed workers are excluded.
- Calculation: Published medians as reported. Differences and ranks computed by Hollerly. Values for 2016 and 2018 match across both releases.
- Limitations: The tenure supplement runs every two years, so single-year changes are not available. Estimates for occupation groups carry sampling error, so differences of 0.1 to 0.2 years may not be statistically significant. BLS does not publish tenure by age within sales occupations.
Sources
- BLS Employee Tenure, Table 6 (January 2026 data): bls.gov/news.release/tenure.t06.htm
- BLS Employee Tenure, September 2018 release (archived): bls.gov/news.release/archives/tenure_09202018.htm
- BLS Employee Tenure technical note: bls.gov/news.release/tenure.tn.htm
Source: Hollerly, How Long Salespeople Stay in Their Jobs, October 2026. https://hollerlyai.com/research/sales-job-tenure
Charts and data are free to use under CC BY 4.0 with a link to this page. Press questions: hello@hollerlyai.com