The median US sales worker is 40.7 years old, and workers under 25 hold 18.8% of sales jobs
The Age of the US Sales Workforce. Published October 2026.
Hollerly analysis of BLS Current Population Survey annual averages, 2015 to 2025
Key findings
- The median age of employed workers in sales and related occupations was 40.7 in 2025, compared with 42.1 for all employed workers.
- Workers age 16 to 24 held 18.8% of sales and related jobs in 2025, down from 20.6% in 2015.
- In B2B-oriented sales roles (wholesale, manufacturing and services sales reps, non-retail sales supervisors and advertising sales agents), workers under 25 held just 5.2% of jobs in 2025.
- Workers 55 and older held 25.5% of B2B-oriented sales jobs in 2025, compared with 23.2% of all jobs.
- The median wholesale and manufacturing sales rep was 44.2 years old in 2025, and the median sales manager was 43.9.
- Real estate brokers and agents had the oldest median age among the sales occupations tracked, at 49.8, while cashiers had the youngest, at 26.1.
Two sales workforces
The headline median age for sales, 40.7 in 2025, blends two very different groups. Retail salespersons and cashiers account for a large part of the BLS sales category, and they skew young: the median cashier was 26.1 and the median retail salesperson 35.8.
B2B-oriented roles look different. Every one of the business-facing sales occupations in the table below had a median age above 41, and most were above the 42.1-year median for all employed workers.
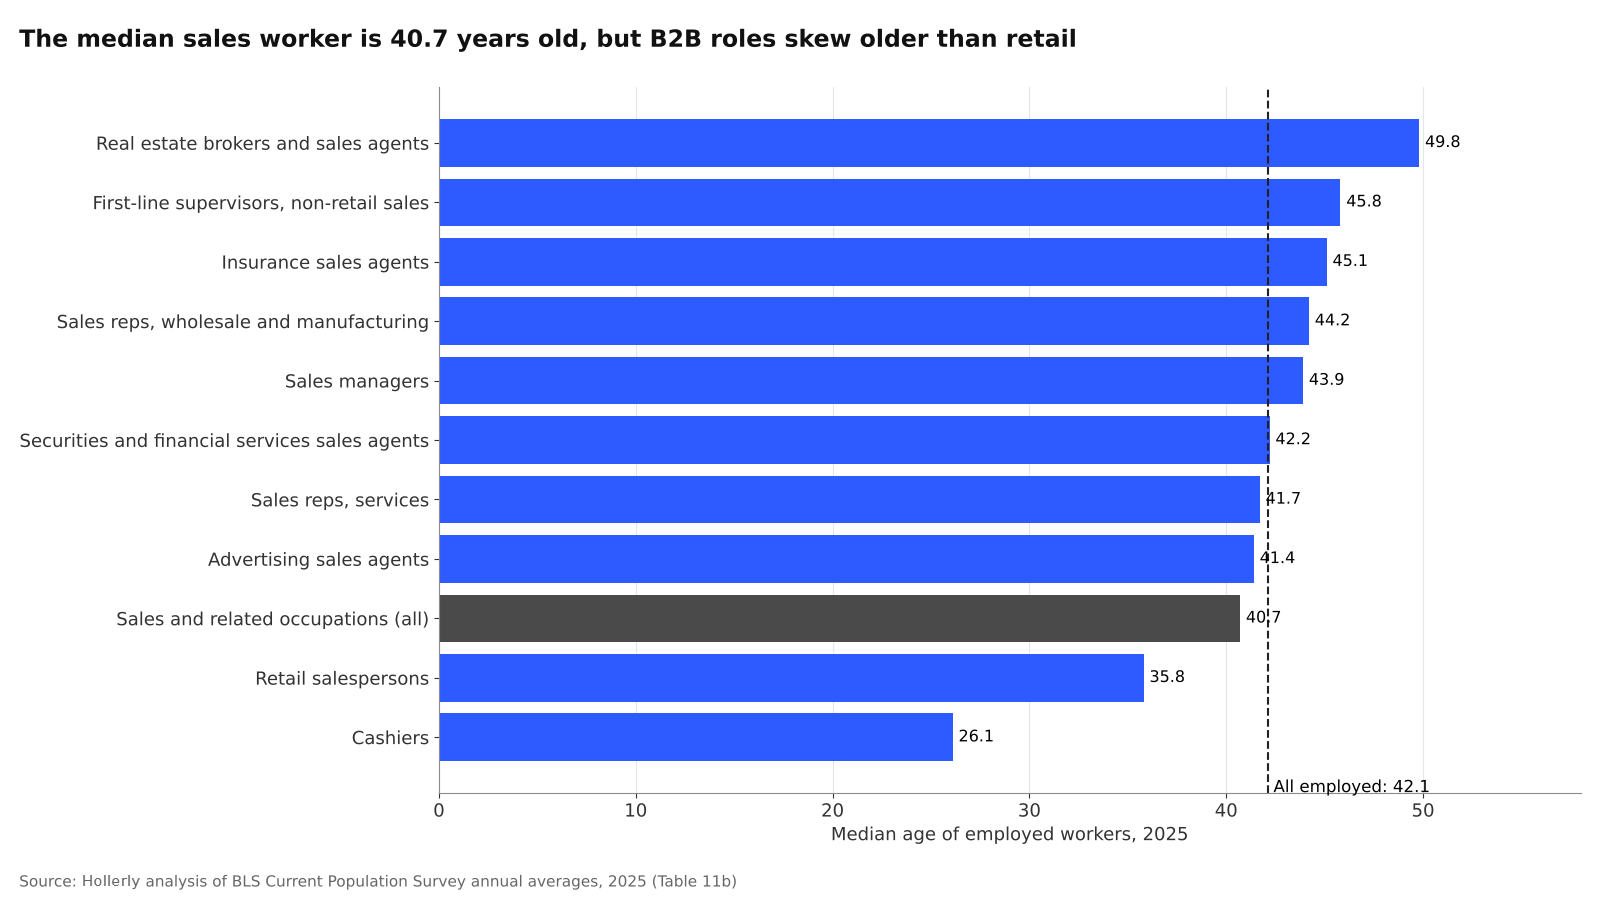
| Occupation | Employed 2025 (thousands) | Median age | Under 25 | 55 and over |
|---|---|---|---|---|
| Sales managers | 563 | 43.9 | 1.8% | 21.7% |
| First-line supervisors, non-retail sales | 1,036 | 45.8 | 4.1% | 27.7% |
| Sales reps, wholesale and manufacturing | 1,145 | 44.2 | 5.3% | 25.5% |
| Sales reps, services | 695 | 41.7 | 6.9% | 22.9% |
| Advertising sales agents | 138 | 41.4 | 3.6% | 22.5% |
| Insurance sales agents | 618 | 45.1 | 5.0% | 29.4% |
| Securities and financial services sales agents | 199 | 42.2 | 11.1% | 22.6% |
| Real estate brokers and sales agents | 1,065 | 49.8 | 4.2% | 37.6% |
| Retail salespersons | 2,661 | 35.8 | 27.9% | 22.4% |
| Cashiers | 2,490 | 26.1 | 48.7% | 15.3% |
| Sales and related occupations (all) | 14,159 | 40.7 | 18.8% | 23.9% |
| All employed | 163,493 | 42.1 | 12.2% | 23.2% |
How young are B2B sales teams
Grouping the four B2B-oriented occupations that can be tracked consistently since 2015 (non-retail sales supervisors, wholesale and manufacturing sales reps, services sales reps and advertising sales agents), workers under 25 held 5.2% of jobs in 2025. That compares with 18.8% across all sales occupations and 12.2% of all jobs. Workers 25 to 34 held 21.9% of B2B-oriented sales jobs, close to the all-jobs figure.
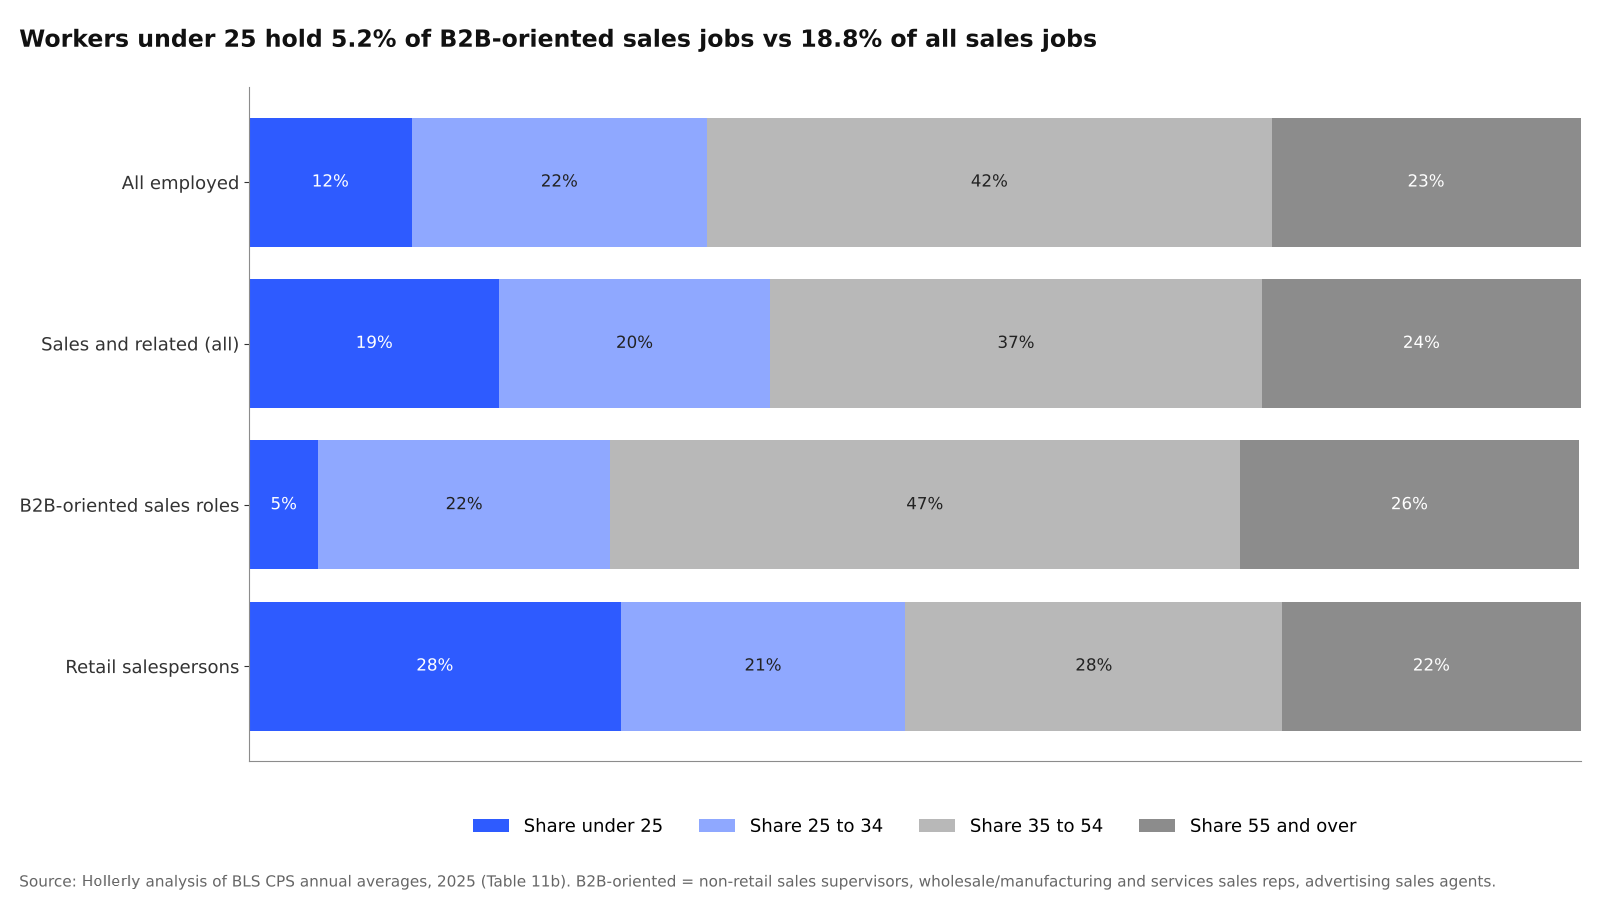
The age mix in these B2B roles has been stable. The under-25 share ranged from 5.2% to 6.9% between 2015 and 2025, and the 55-and-over share ranged from 25.5% to 27.1%.
A note on generations
Generation labels are popular in coverage of the workforce, but CPS age bands (16 to 19, 20 to 24, 25 to 34 and so on) do not line up with generational birth years. This study reports age bands as published rather than estimating generational shares.
To reach these buyers directly, Hollerly's LinkedIn prospecting software finds the right people on LinkedIn and writes each first message with AI.
About the data
- Source: U.S. Bureau of Labor Statistics, Current Population Survey (CPS) annual averages, Table 11b, "Employed persons by detailed occupation and age," 2015 to 2025. The 2025 table (published February 2026) is the latest.
- Measures: Published employment counts by age band and published median age. Shares by age band are computed by Hollerly from the published counts.
- B2B-oriented grouping: A Hollerly grouping of four CPS occupations: first-line supervisors of non-retail sales workers, wholesale and manufacturing sales reps, services sales reps and advertising sales agents. Sales managers are reported separately and only from 2020, because the 2015 to 2019 tables combine marketing and sales managers. No median age is computed for the grouping.
- Limitations: CPS occupation coding changed in 2020, and the services sales rep category changed scope, so detailed occupations are not strictly comparable across 2019 and 2020. Smaller occupations have wider sampling error; BLS does not publish a median age for occupations with fewer than 50,000 workers (sales engineers and telemarketers in some years). CPS counts include self-employed workers.
Sources
- BLS CPS annual averages, Table 11b (2025): bls.gov/cps/cpsaat11b.htm
- BLS CPS annual averages, Table 11b (2024): bls.gov/cps/data/aa2024/cpsaat11b.htm
- BLS CPS annual averages, Table 11b (2015): bls.gov/cps/aa2015/cpsaat11b.htm
- All 11 annual tables are listed in the Sources tab of data.xlsx.
Source: Hollerly, The Age of the US Sales Workforce, October 2026. https://hollerlyai.com/research/sales-workforce-age
Charts and data are free to use under CC BY 4.0 with a link to this page. Press questions: hello@hollerlyai.com