Women hold 29.9% of B2B sales rep jobs and 33.2% of sales manager jobs
Women in Sales Roles, 2015 to 2025. Published October 2026.
Hollerly analysis of BLS Current Population Survey annual averages, 2015 to 2025
Key findings
- Women made up 29.9% of wholesale, manufacturing and services sales representatives in 2025, compared with 29.8% in 2015.
- Women held 33.2% of sales manager jobs in 2025, up from 30.9% in 2020.
- Across all sales and related occupations, which include retail, women were 47.4% of workers in 2025, close to their 47.1% share of total employment.
- Women working full time in sales and related occupations had median weekly earnings of $906 in 2025, 72.0% of the $1,258 median for men.
- Among wholesale and manufacturing sales reps, women's median weekly earnings were 83.0% of men's in 2025.
- Sales engineering has the lowest share of women among the sales occupations tracked, at 15.2% in 2025.
Representation depends on the type of sales job
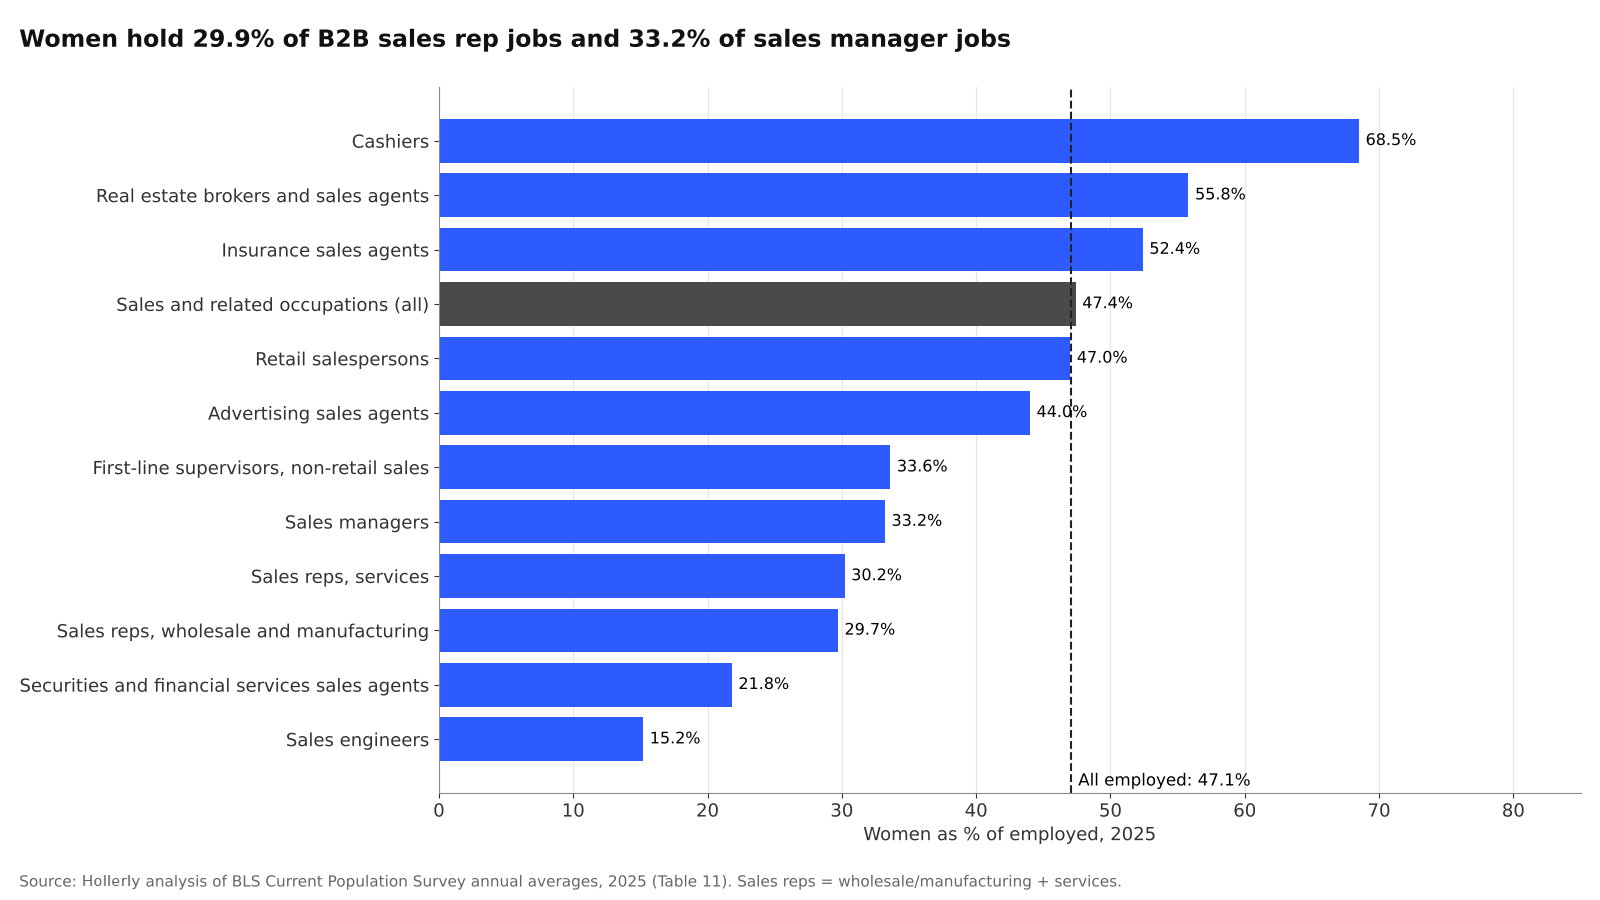
Women make up close to half of the overall BLS sales category (47.4% in 2025), but that average hides a wide spread. Several consumer-facing roles are above parity: women were 68.5% of cashiers, 55.8% of real estate brokers and agents, and 52.4% of insurance sales agents.
Business-to-business roles are a different picture. Women held 29.7% of wholesale and manufacturing sales rep jobs, 30.2% of services sales rep jobs and 15.2% of sales engineer jobs in 2025.
A stable share over the past decade
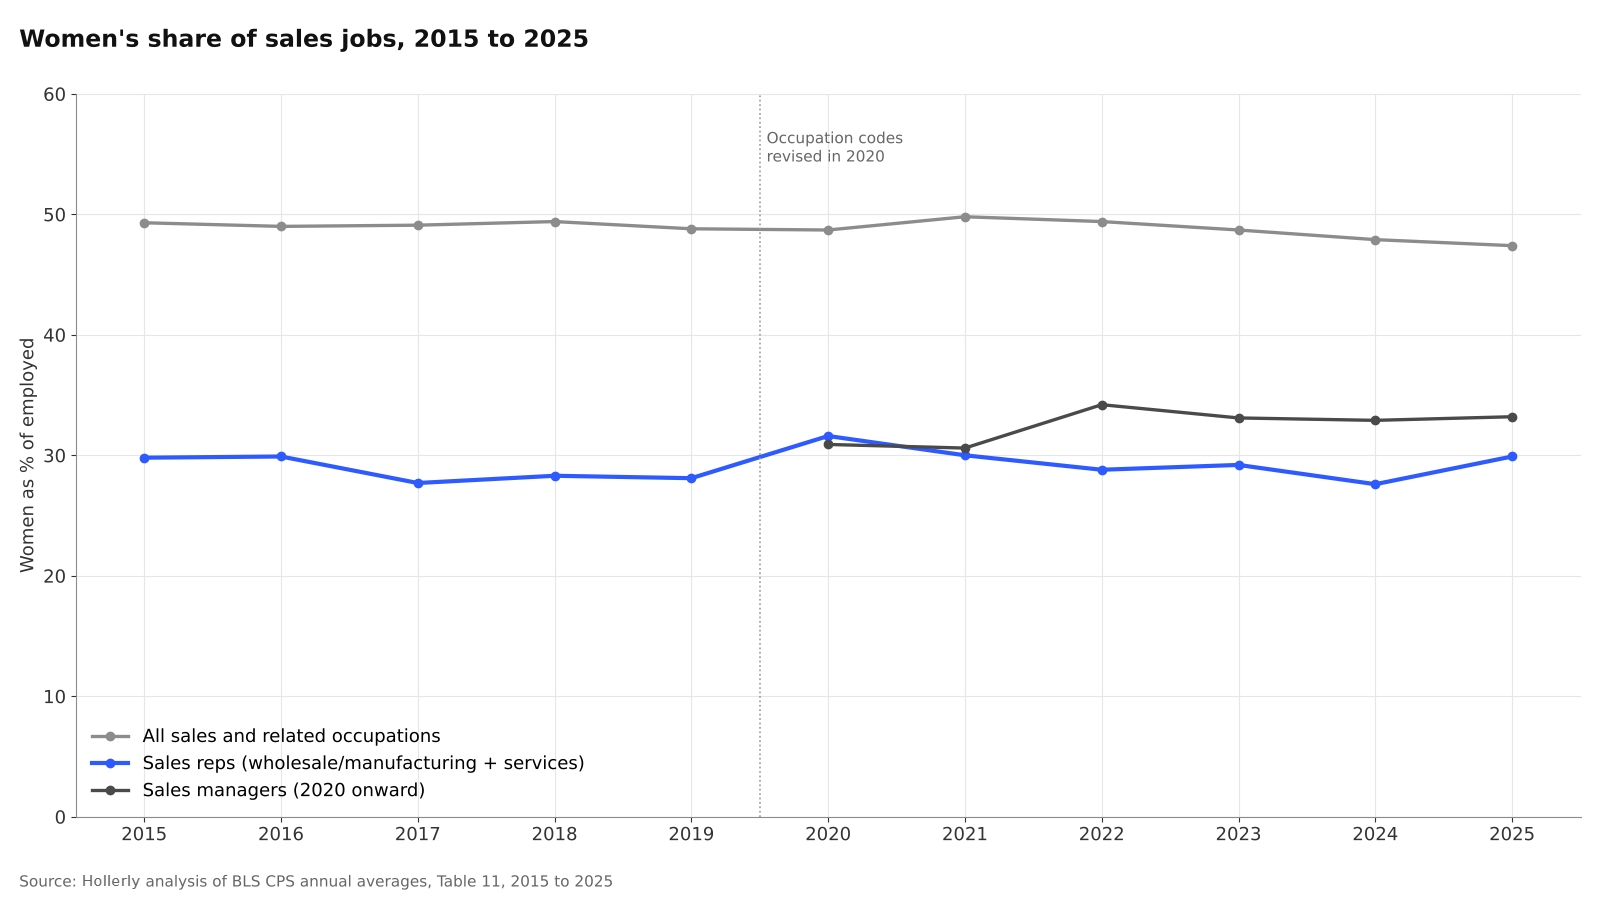
Combining wholesale, manufacturing and services sales reps, the share of women has stayed within a narrow range: between 27.6% and 31.6% in every year from 2015 to 2025. For sales managers, comparable data begins in 2020, when BLS started reporting sales managers separately from marketing managers. The share of women rose from 30.9% that year to 33.2% in 2025.
Pay by sex
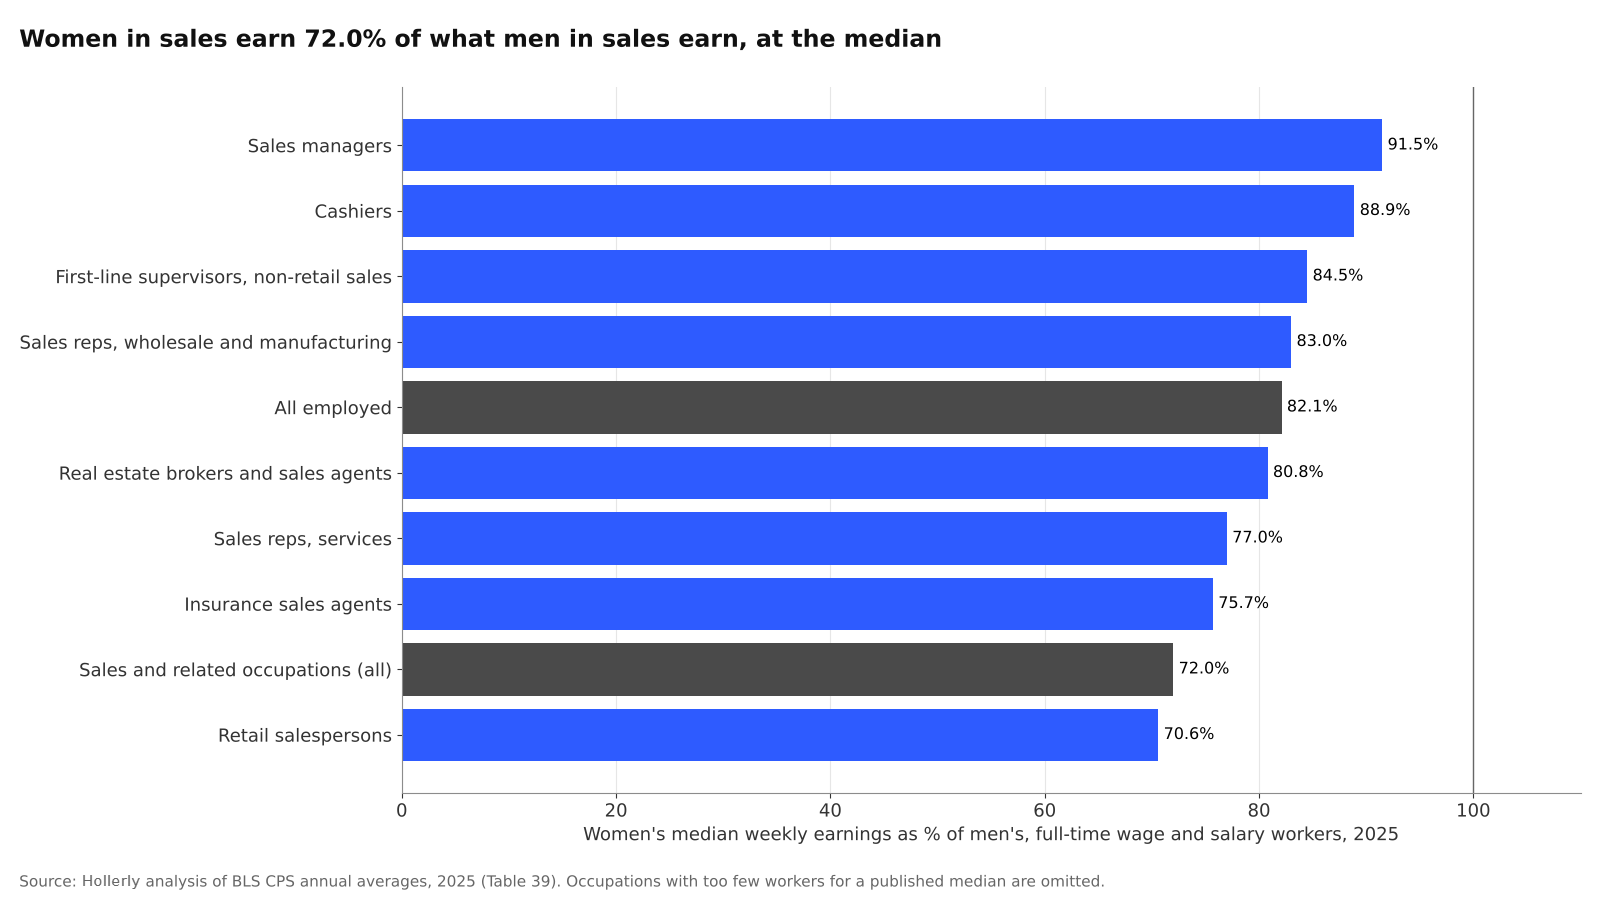
BLS also publishes median weekly earnings for full-time wage and salary workers by occupation and sex. In 2025, women in sales and related occupations earned 72.0% of what men earned at the median, below the 82.1% ratio for all full-time workers. Part of that gap may reflect the mix of jobs within the category. For example, women were 68.5% of cashiers, the lowest-paid sales occupation in the table below.
Within individual B2B occupations, the ratios are higher than for sales overall. Women's median earnings were 83.0% of men's among wholesale and manufacturing reps and 77.0% among services reps in 2025.
| Occupation | Women, % of employed | Median weekly, men | Median weekly, women | Women's earnings as % of men's |
|---|---|---|---|---|
| Sales managers | 33.2% | $2,085 | $1,907 | 91.5% |
| First-line supervisors, non-retail sales | 33.6% | $1,497 | $1,265 | 84.5% |
| Sales reps, wholesale and manufacturing | 29.7% | $1,532 | $1,272 | 83.0% |
| Sales reps, services | 30.2% | $1,641 | $1,263 | 77.0% |
| Sales engineers | 15.2% | $2,810 | n/a | n/a |
| Advertising sales agents | 44.0% | $1,428 | n/a | n/a |
| Insurance sales agents | 52.4% | $1,435 | $1,087 | 75.7% |
| Securities and financial services sales agents | 21.8% | $2,382 | n/a | n/a |
| Real estate brokers and sales agents | 55.8% | $1,460 | $1,180 | 80.8% |
| Retail salespersons | 47.0% | $1,050 | $741 | 70.6% |
| Cashiers | 68.5% | $694 | $617 | 88.9% |
| Sales and related occupations (all) | 47.4% | $1,258 | $906 | 72.0% |
| All employed | 47.1% | $1,326 | $1,089 | 82.1% |
These are simple medians by sex. They do not adjust for hours beyond the full-time threshold, experience, territory, industry or commission plan design, so they describe pay outcomes rather than pay for identical work.
Hollerly's LinkedIn lead generation automation turns a LinkedIn search into AI-written messages and email follow-ups that stop when someone replies.
About the data
- Source: U.S. Bureau of Labor Statistics, Current Population Survey annual averages. Table 11 (employed persons by detailed occupation, sex, race and Hispanic or Latino ethnicity) and Table 39 (median weekly earnings of full-time wage and salary workers by detailed occupation and sex), 2015 to 2025. The 2025 tables (published February 2026) are the latest.
- Calculations: Women's share is as published. The combined sales rep share sums published employment for wholesale and manufacturing reps and services reps, applies each occupation's published share of women, and divides the total. Earnings ratios are women's median divided by men's median.
- Limitations: CPS occupation codes were revised in 2020. Sales managers were combined with marketing managers before 2020, and the services sales rep category changed scope. BLS does not publish a median where the base is under 50,000 workers, so some earnings ratios are unavailable (for example, sales engineers and advertising sales agents in 2025). CPS estimates for small occupations have wide sampling error. CPS counts include self-employed workers; earnings cover wage and salary workers only.
Sources
- BLS CPS annual averages, Table 11 (2025): bls.gov/cps/cpsaat11.htm
- BLS CPS annual averages, Table 39 (2025): bls.gov/cps/cpsaat39.htm
- BLS CPS annual averages, 2015 tables: bls.gov/cps/aa2015/cpsaat11.htm and bls.gov/cps/aa2015/cpsaat39.htm
- All 22 annual tables are listed in the Sources tab of data.xlsx.
Source: Hollerly, Women in Sales Roles, 2015 to 2025, October 2026. https://hollerlyai.com/research/women-in-sales
Charts and data are free to use under CC BY 4.0 with a link to this page. Press questions: hello@hollerlyai.com