"Best software" questions get 39 AI searches for every 100 on Google, 11.9x the rate of generic queries
Do B2B Buyers Ask AI or Google? Software Research by Channel: an AI and search data study by Hollerly. Published October 2026.
Key findings
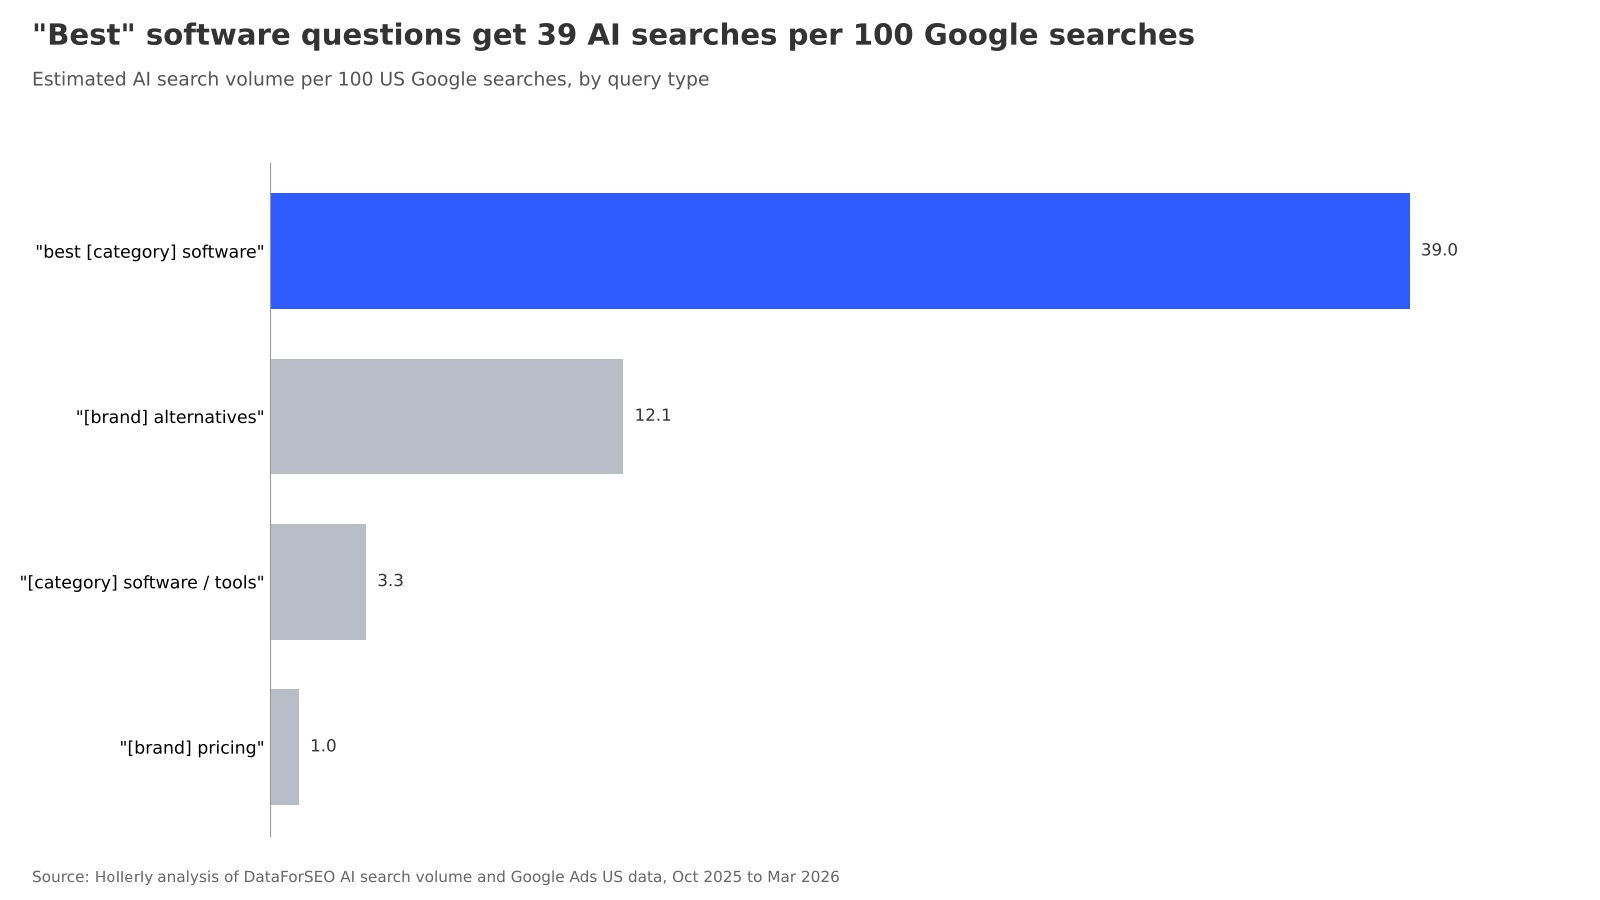
- For every 100 US Google searches for "best [category] software" queries, there were an estimated 39.0 AI searches for the same questions.
- That is 11.9 times the rate for generic category searches such as "crm software", at 3.3 AI searches per 100 Google searches.
- Brand pricing searches lean heavily on Google: 1.0 AI search for every 100 Google searches.
- "[brand] alternatives" queries get 12.1 AI searches per 100 Google searches.
- Across all 220 B2B software queries we measured, AI volume equals 3.7 per 100 Google searches, or 8.8 when password manager queries are left out.
- In 31 of 40 software categories, the "best" version of the query had a higher AI-to-Google ratio than any generic version.
- The median category sees 7.4 AI searches per 100 Google searches.
Google still carries most software research
Buyers now ask AI assistants for software advice, but how much compared with Google? We matched estimated AI search volume with US Google search volume for 220 B2B software buying queries across 40 categories and 50 brands, over the same six months.
Google still carries most of the volume. Across all 220 queries, AI volume equals 3.7 searches for every 100 on Google. One very large category, password managers, pulls that number down; without it the figure is 8.8.
"Best" questions are where AI shows up
The type of question matters more than the category. When the query asks for a recommendation, such as "best crm software" or "best payroll software", AI volume reaches 39.0 per 100 Google searches. Generic category searches like "crm software" sit at 3.3, so recommendation queries run at 11.9 times the rate. In 31 of 40 categories, the "best" query had a higher AI share than any other version of that category's query.
| Query type | Keywords | AI searches (6 months) | Google searches (6 months) | AI per 100 Google | Median keyword |
|---|---|---|---|---|---|
| "best [category] software" | 40 | 82,644 | 211,910 | 39.0 | 31.9 |
| "[brand] alternatives" | 50 | 22,395 | 184,970 | 12.1 | 5.4 |
| "[category] software / tools" | 80 | 436,431 | 13,278,900 | 3.3 | 6.8 |
| "[brand] pricing" | 50 | 12,418 | 1,276,260 | 1.0 | 0.4 |
Brand pricing questions are the opposite. People looking up what a named product costs still go to Google, with only 1.0 AI searches per 100 Google searches. "Alternatives" queries sit in between at 12.1.
Categories differ
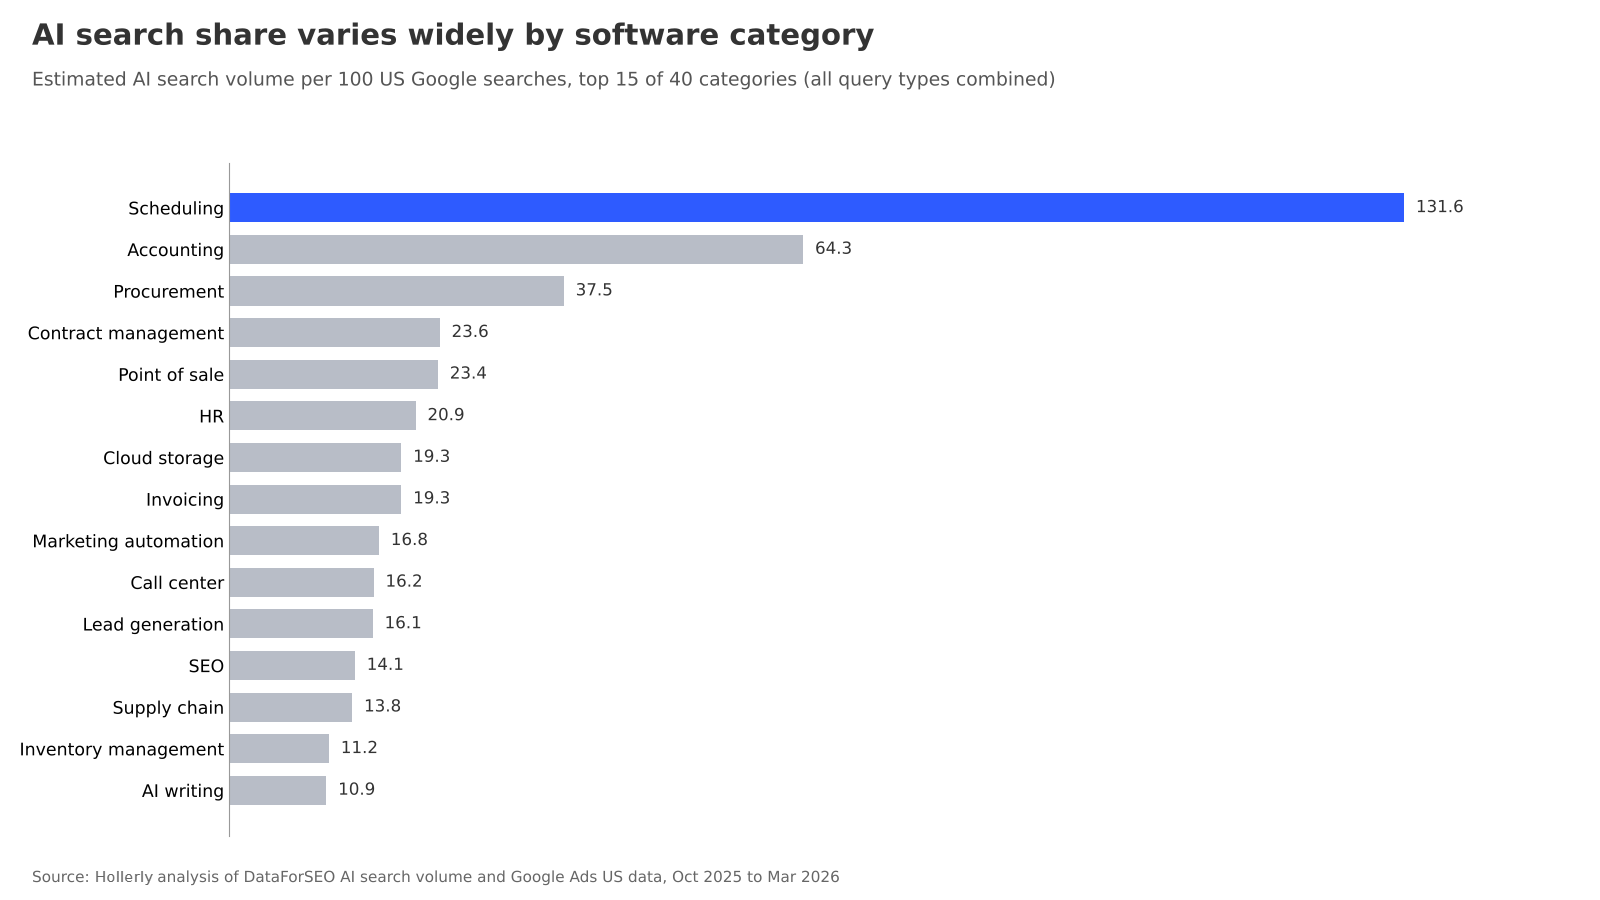
The AI share ranges widely across categories, from well under 1 per 100 to more than the Google volume itself. Scheduling and accounting software top the list.
What this means for B2B marketers
Buyers who want a recommendation are the ones most likely to ask AI. Buyers checking price or a specific product still mostly search Google. Visibility in AI answers matters most for "best of" and comparison content, while pricing and product pages still earn most of their discovery from search engines.
Recommendation content is where this shows up first, and AI is now part of the sales stack as well. Hollerly's AI SDR software researches leads, writes LinkedIn and email outreach and drafts replies, with a person approving every campaign.
About the data
- AI searches: modeled estimates of how often each query is asked in AI assistants, United States, English.
- Google searches: monthly US Google search volume (English) for the same queries and months.
- Period: October 2025 to March 2026, the six months where both measures overlap before a step change in Google search volumes from April 2026 that affects several large categories.
- Sample: 220 queries: 120 category queries for 40 B2B software categories ("[category] software", "best [category] software", "[category] tools") and 100 brand queries ("[brand] alternatives" and "[brand] pricing" for 50 brands). All 220 have six months of data on both sides.
- Calculation: AI searches divided by Google searches for the same months, times 100, summed by query type or category. Medians per keyword are shown in data.xlsx alongside aggregates.
- Limitations: AI search volume is a modeled estimate, not a count reported by AI providers, and the two measures are built differently, so ratios are indicative. AI prompts are often longer and phrased as full questions, so exact-match volumes undercount AI demand for a topic. 8 of 220 queries show more AI than Google volume. Results are aggregate; no brand is ranked.
Sources
- Modeled estimates of US AI assistant query volume (English), October 2025 to March 2026
- US Google search volume (English), monthly, October 2025 to March 2026
Source: Hollerly, Do B2B Buyers Ask AI or Google? Software Research by Channel, October 2026. https://hollerlyai.com/research/ai-vs-google-b2b-software-research
Charts and data are free to use under CC BY 4.0 with a link to this page. Press questions: hello@hollerlyai.com