B2B software research peaks in October and bottoms out in February
Seasonality of B2B Buying Research: a search data study by Hollerly. Published October 2026.
Key findings
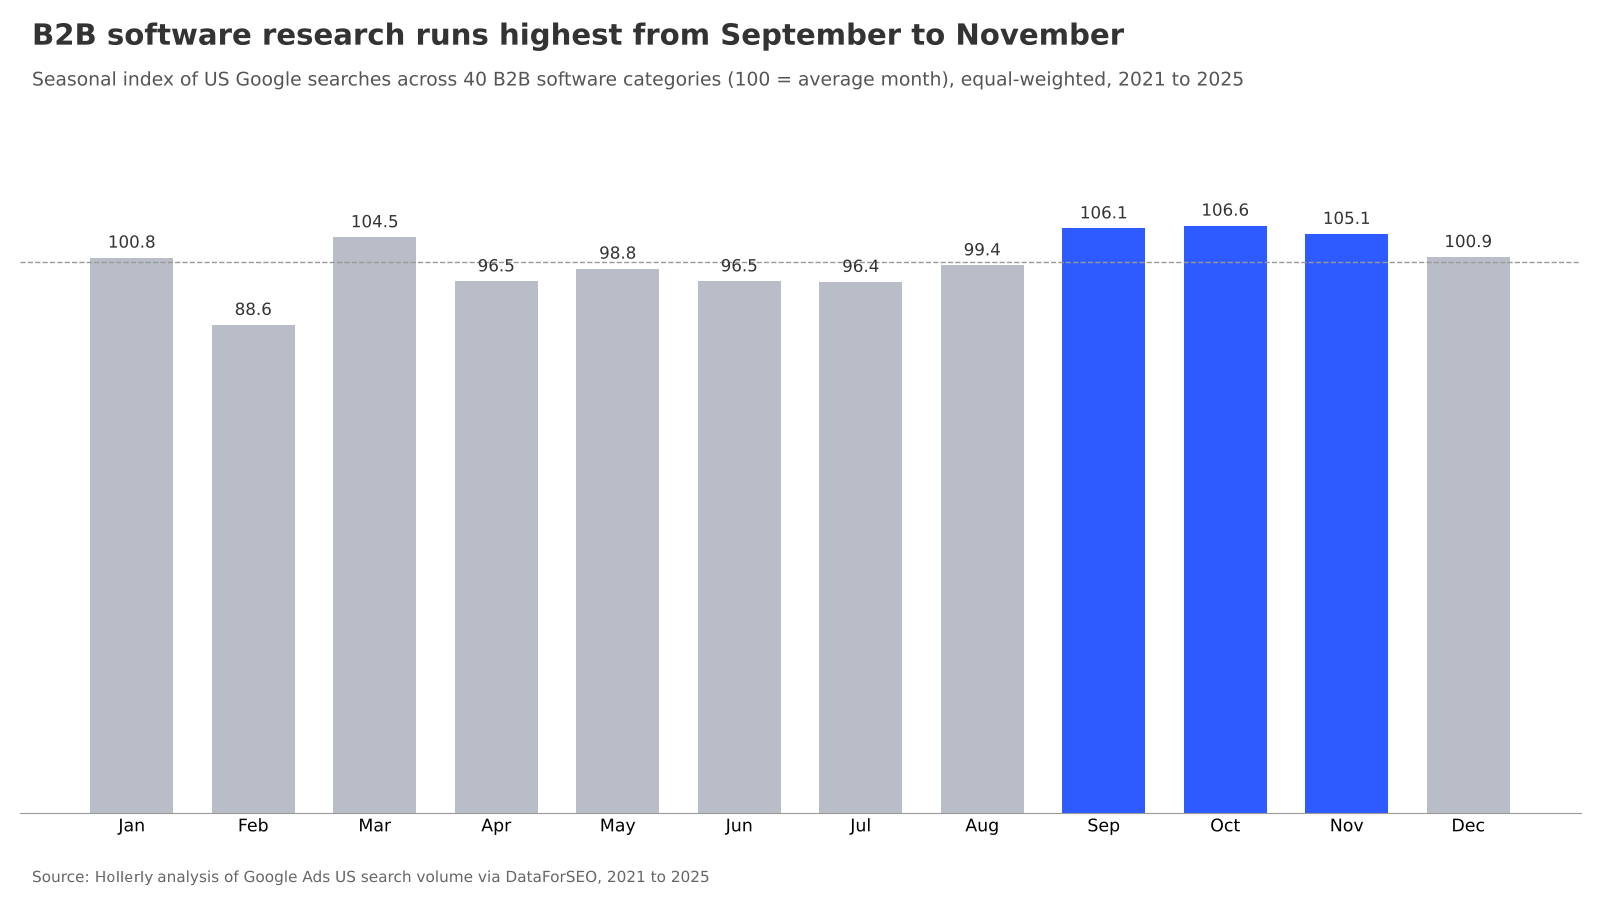
- Across 40 B2B software categories, US search demand runs 5.9% above the average month from September to November.
- October is the strongest month, with a seasonal index of 106.6 (100 = average month), followed by September at 106.1.
- February is the weakest month at 88.6, or 11.4% below average.
- Adjusting for February having fewer days, its per-day index is 95.6, and July becomes the lowest month per day at 94.6.
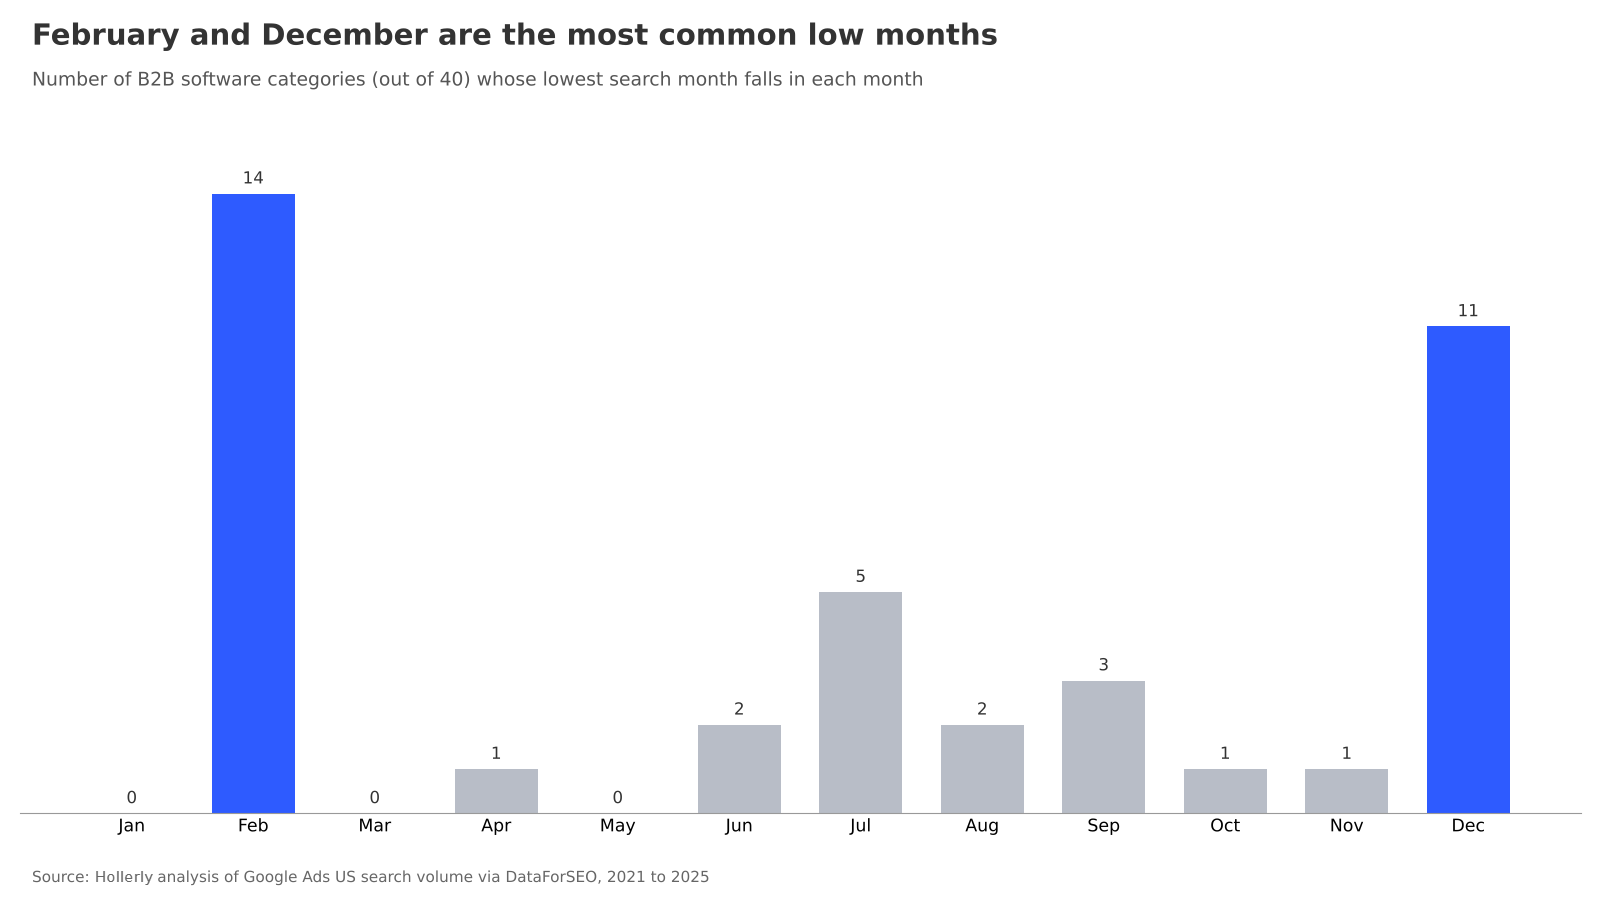
- 14 of 40 categories have their lowest month in February and 11 in December.
- March is the most common peak month: 8 of 40 categories hit their high in March.
- October beat the average month in 4 of the 5 years studied.
A fall high and a February low
Sales teams often plan outbound around the calendar: push in Q4, ease off in summer, restart in January. Search data gives a way to check that rhythm against what buyers actually research. This study looks at five years of monthly US Google searches for 116 keywords across 40 B2B software categories, from CRM and payroll to procurement and help desk software.
The pattern is real but mild. Research volume climbs in September and stays elevated through November, averaging 105.9 on an index where 100 is a typical month. October is the single strongest month at 106.6. February is the weakest at 88.6.
Part of the February dip is the calendar
February has two or three fewer days than other months. When we convert each month to searches per day, February's index rises to 95.6 and July (94.6) becomes the quietest month per day. September stays on top either way, at 107.6 per day.
Categories do not move in lockstep
Each category has its own rhythm. March is the most common peak month (8 categories), followed by September (6). Lows cluster in February (14 categories) and December (11).
| Month | Seasonal index | Per-day index | Categories peaking | Categories bottoming |
|---|---|---|---|---|
| January | 100.8 | 98.9 | 2 | 0 |
| February | 88.6 | 95.6 | 0 | 14 |
| March | 104.5 | 102.5 | 8 | 0 |
| April | 96.5 | 97.9 | 1 | 1 |
| May | 98.8 | 97.0 | 5 | 0 |
| June | 96.5 | 97.9 | 2 | 2 |
| July | 96.4 | 94.6 | 2 | 5 |
| August | 99.4 | 97.6 | 2 | 2 |
| September | 106.1 | 107.6 | 6 | 3 |
| October | 106.6 | 104.6 | 5 | 1 |
| November | 105.1 | 106.6 | 4 | 1 |
| December | 100.9 | 99.1 | 3 | 11 |
Some categories barely move
The size of the seasonal swing differs by category. Measured as the gap between a category's strongest and weakest month, point of sale (16.2 points) and inventory management (17.8) software are the steadiest. AI writing (117.3) and applicant tracking (86.0) software swing the most. The median category's gap is 39.4 points.
What it means for outbound timing
The swing between the strongest and weakest months is 18.0 index points, so buyers research software all year. The fall months carry the most research, which supports heavier prospecting from September onward. A short month explains part of the February dip, and even per day, February research is 4.4% below a typical month.
For the prospecting itself, Hollerly's LinkedIn prospecting software finds the right people on LinkedIn and keeps outreach running at a steady pace all year.
About the data
- Data: monthly US Google search volume (English), calendar years 2021 to 2025 (60 months). 2020 and 2026 are partial years and are not included.
- Sample: 40 B2B software categories, each represented by up to three generic keywords ("[category] software", "best [category] software", "[category] tools"). 116 keywords with a complete monthly series for 2021 to 2025. No brand names.
- Index: for each category and year, each month's searches divided by that year's monthly average, times 100. The five yearly values are averaged to give each category's seasonal profile. The overall index is the simple average of the 40 category profiles, so every category counts equally. This matters because the password manager category alone is about 72% of total volume in the basket and would otherwise set the pattern. The per-day index is the same calculation on each month's searches divided by its number of days.
- Spikes: isolated one-month values more than 4 times a keyword's centered 7-month rolling median are replaced with that median. Raw values are in the Raw tab.
- Limitations: search volumes are rounded estimates, and small keywords move in coarse steps. Search research is a proxy for buying interest, not purchases. Year-to-year patterns vary (see Years tab in data.xlsx).
Sources
- US Google search volume (English), monthly, January 2021 to December 2025
Source: Hollerly, Seasonality of B2B Buying Research, October 2026. https://hollerlyai.com/research/b2b-buying-research-seasonality
Charts and data are free to use under CC BY 4.0 with a link to this page. Press questions: hello@hollerlyai.com