Searches for B2B events are up 123% since 2020-21 while webinar searches fell 71%
B2B Events and Webinars: Is Demand Back?: a search data study by Hollerly. Published October 2026.
Key findings
- US searches for in-person B2B event terms were 122.8% higher in the 12 months to August 2026 than in the 12 months to August 2021.
- Searches for webinar and virtual event terms fell 71.1% over the same period.
- All 11 in-person event terms we tracked grew, and all 11 webinar and virtual event terms declined.
- In 2020-21, in-person and webinar terms drew roughly equal search volume (0.98 to 1); in the latest 12 months in-person terms drew 7.6 times as many searches.
- Compared with the prior 12 months, in-person event searches changed -4.1% and webinar searches -38.0%.
- Leaving out the fastest-growing term ("conference venue"), in-person event searches are still up 114.5% on 2020-21.
In-person demand kept climbing
In late 2020, when this data series begins, in-person events were largely on hold and webinars were the default. Search demand reflected that: terms such as "trade show", "business conferences" and "networking events" drew about the same US search volume as "webinar platform", "virtual events" and "online webinar".
Five years later the picture has flipped. In-person event searches in the 12 months to August 2026 were 122.8% above the 2020-21 baseline. Webinar and virtual event searches were 71.1% below it.
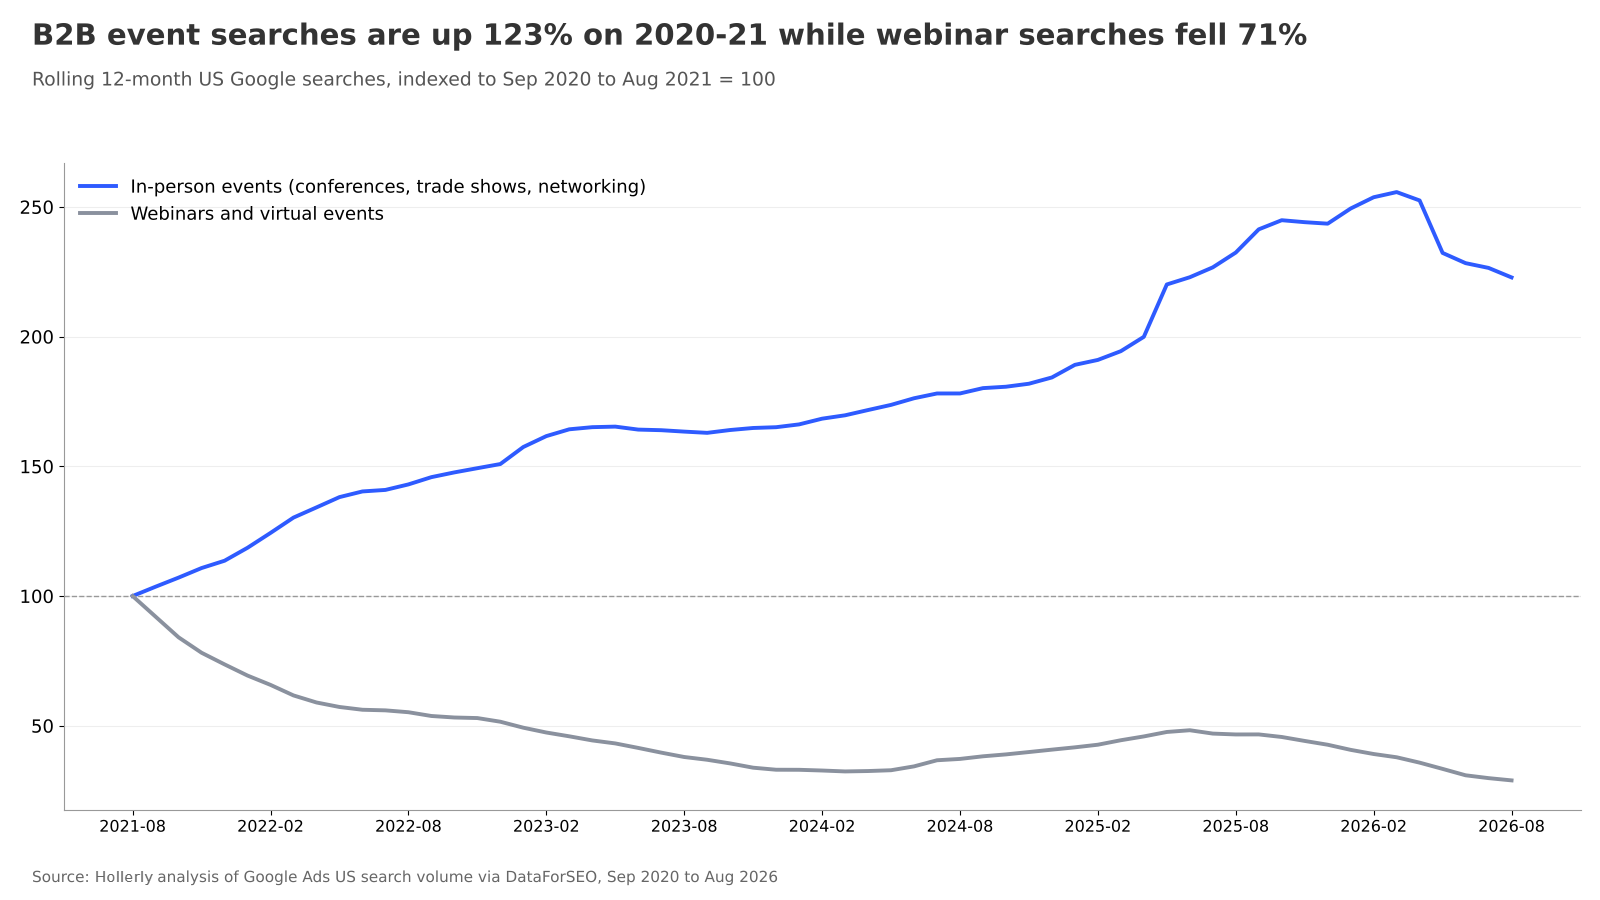
| 12 months to August | In-person events index | Webinars and virtual index |
|---|---|---|
| 2021 | 100.0 | 100.0 |
| 2022 | 143.0 | 55.2 |
| 2023 | 163.4 | 38.0 |
| 2024 | 178.1 | 37.2 |
| 2025 | 232.4 | 46.6 |
| 2026 | 222.8 | 28.9 |
Every term moved the same way
The shift is not driven by one keyword. Each of the 11 in-person terms in our set grew against 2020-21, and each of the 11 webinar and virtual terms fell.
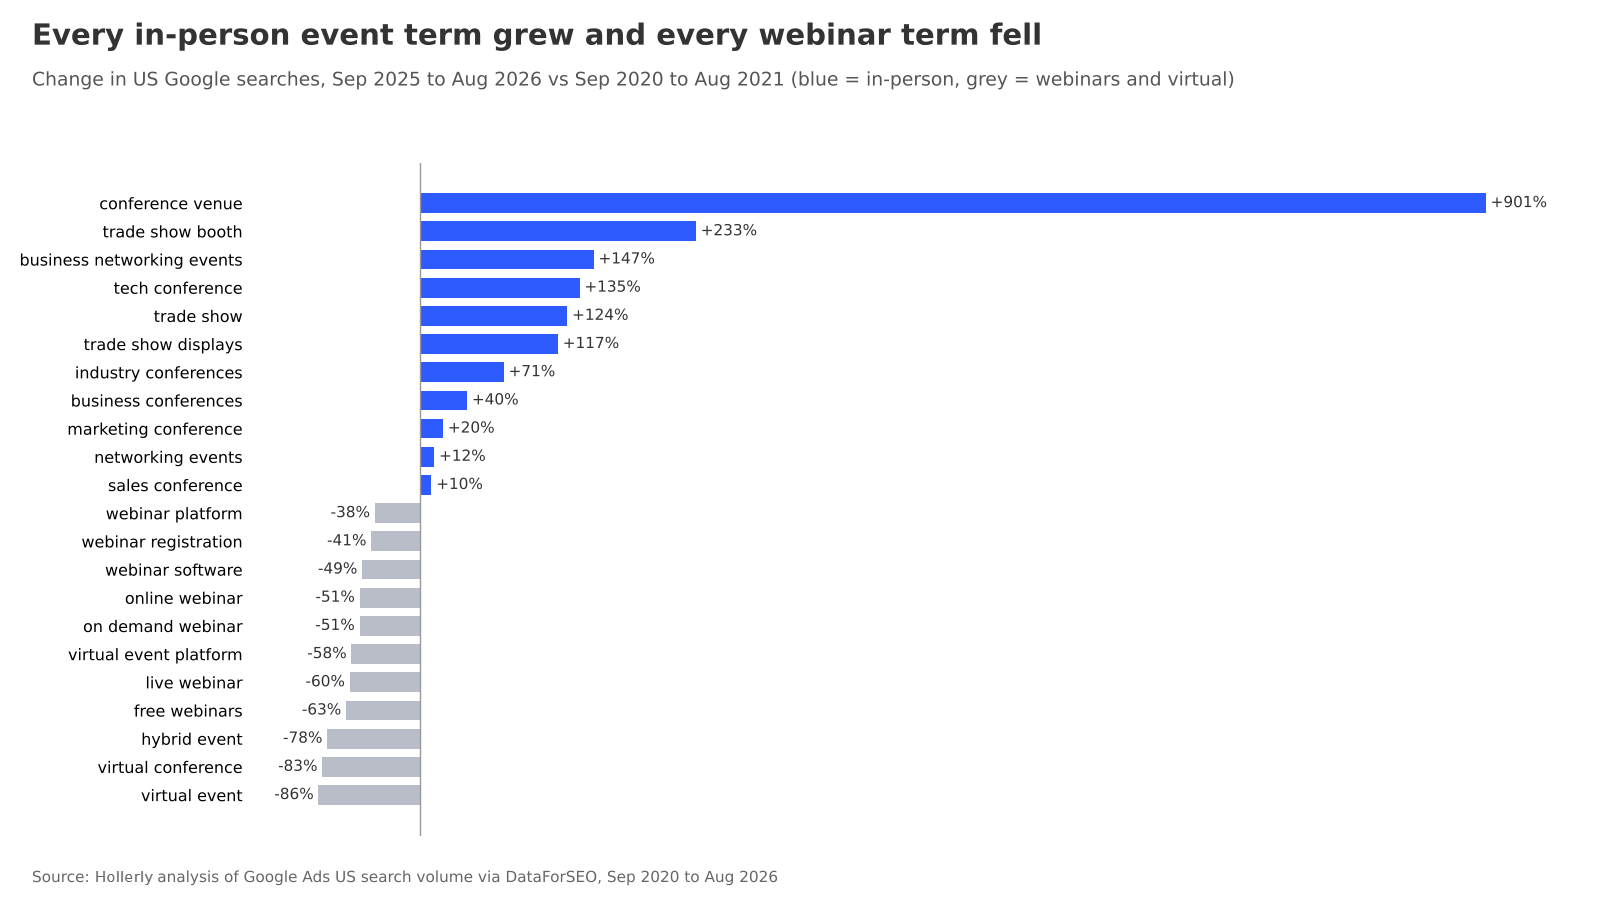
Among in-person terms, "trade show booth" (+233.2%), "business networking events" (+146.8%) and "tech conference" (+134.9%) grew the most, apart from "conference venue". On the virtual side, "virtual event" (-85.9%), "virtual conference" (-82.7%) and "hybrid event" (-78.5%) fell the furthest. Searches tied to running webinars held up better: "webinar platform" was down 38.3%.
The latest year
Both baskets dipped in the most recent 12 months. In-person searches changed -4.1% and webinar searches -38.0% compared with the year before. In-person demand remains well above its pandemic-era level, while webinar demand continues to shrink.
What it means for B2B marketers
Search interest has moved back toward events people attend in person. Webinars still draw searches, but far fewer than in 2020-21. For sales and marketing teams planning event budgets, in-person formats now carry more of the search demand.
Events create a short list of people worth following up with. Hollerly's LinkedIn lead generation automation turns that list into AI-written messages and email follow-ups that stop when someone replies.
About the data
- Data: monthly US Google search volume (English), September 2020 to August 2026. The series starts in late 2020 (August 2020 for a few keywords, September 2020 for most), so 2019 levels are not available. The baseline is the first full 12 months, September 2020 to August 2021, a period when many in-person events were paused. Results describe change since that period, not a return to pre-2020 levels.
- Sample: 22 keywords, 11 in-person event terms and 11 webinar and virtual event terms, from a starting set of 30. Close variants that share identical volume (for example "trade shows" and "trade show") count once, single generic words ("conference", "expo", "webinar") whose meaning is too broad to attribute to B2B are not included, and neither is the brand term "zoom webinar". The full list and reasons are in data.xlsx.
- Sensitivity: with the generic words and brand term included, the in-person basket is at 96.0 and the webinar basket at 37.9 against the baseline (100). The generic word "conference" is the largest term in the set and its monthly volume fell from 110,000 in August 2022 to 49,500 in September 2022, which pulls the broad in-person total down. Webinar demand falls under either definition. Trade show terms peak each January and February and are the largest in-person terms; leaving all three out, in-person searches are still up 73.4% on the baseline.
- Index: searches summed by basket for each 12-month window and indexed to the baseline window.
- Spikes: isolated one-month values more than 4 times a keyword's centered 7-month rolling median are replaced with that median.
- Limitations: search volumes are rounded estimates. The sample is small. Search interest is not attendance.
Sources
- US Google search volume (English), monthly, September 2020 to August 2026
Source: Hollerly, B2B Events and Webinars: Is Demand Back?, October 2026. https://hollerlyai.com/research/b2b-events-vs-webinars-demand
Charts and data are free to use under CC BY 4.0 with a link to this page. Press questions: hello@hollerlyai.com