B2B software research dips only 8.9% in December, then rebounds in January
The Holiday Slump Myth in B2B: a search data study by Hollerly. Published October 2026.
Key findings
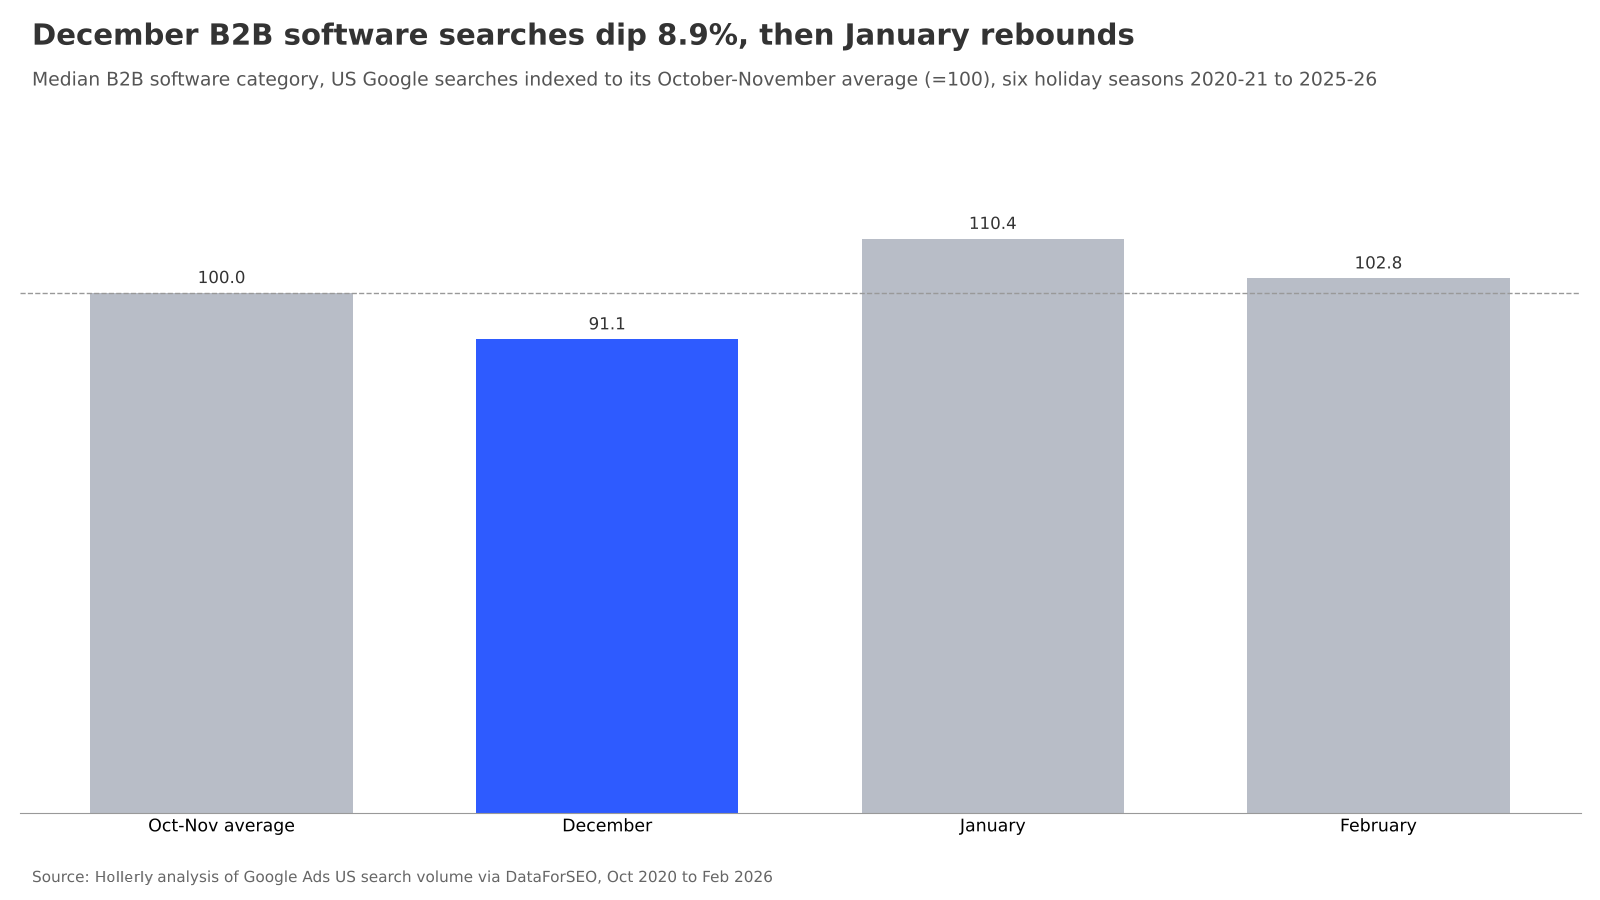
- B2B software search demand in December is a median 8.9% below the October-November average across 40 categories and six holiday seasons.
- January searches run a median 10.4% above the October-November average.
- In 192 of 240 category-seasons (80%), January search volume was higher than December.
- December searches fell below the fall average in 166 of 240 category-seasons (69%) and rose in 69.
- Only 3 of 240 category-seasons saw December searches fall by half or more.
- The size of the dip varies by year: the median category was down 25.0% in December 2025 but up 4.3% in December 2024.
A dip, not a shutdown
Many sellers write off December. The assumption is that buyers stop researching software until the new year. We tested that with six holiday seasons of US Google search data for 40 B2B software categories, comparing each category's December searches with its own October-November average.
December does dip. For the median category, December searches were 8.9% below the fall average. That is a modest drop: buyers keep researching through the month, and only 3 of 240 category-seasons saw demand fall by half or more.
January comes back strong
The rebound is the clearer pattern. January searches ran a median 10.4% above the October-November average, and in 80% of category-seasons January beat December. February then settles back to a median +2.8% against the fall average.
The size of the dip changes every year
The December effect is not fixed. In the 2024-25 season the median category actually gained 4.3% in December, while in 2025-26 it fell 25.0%.
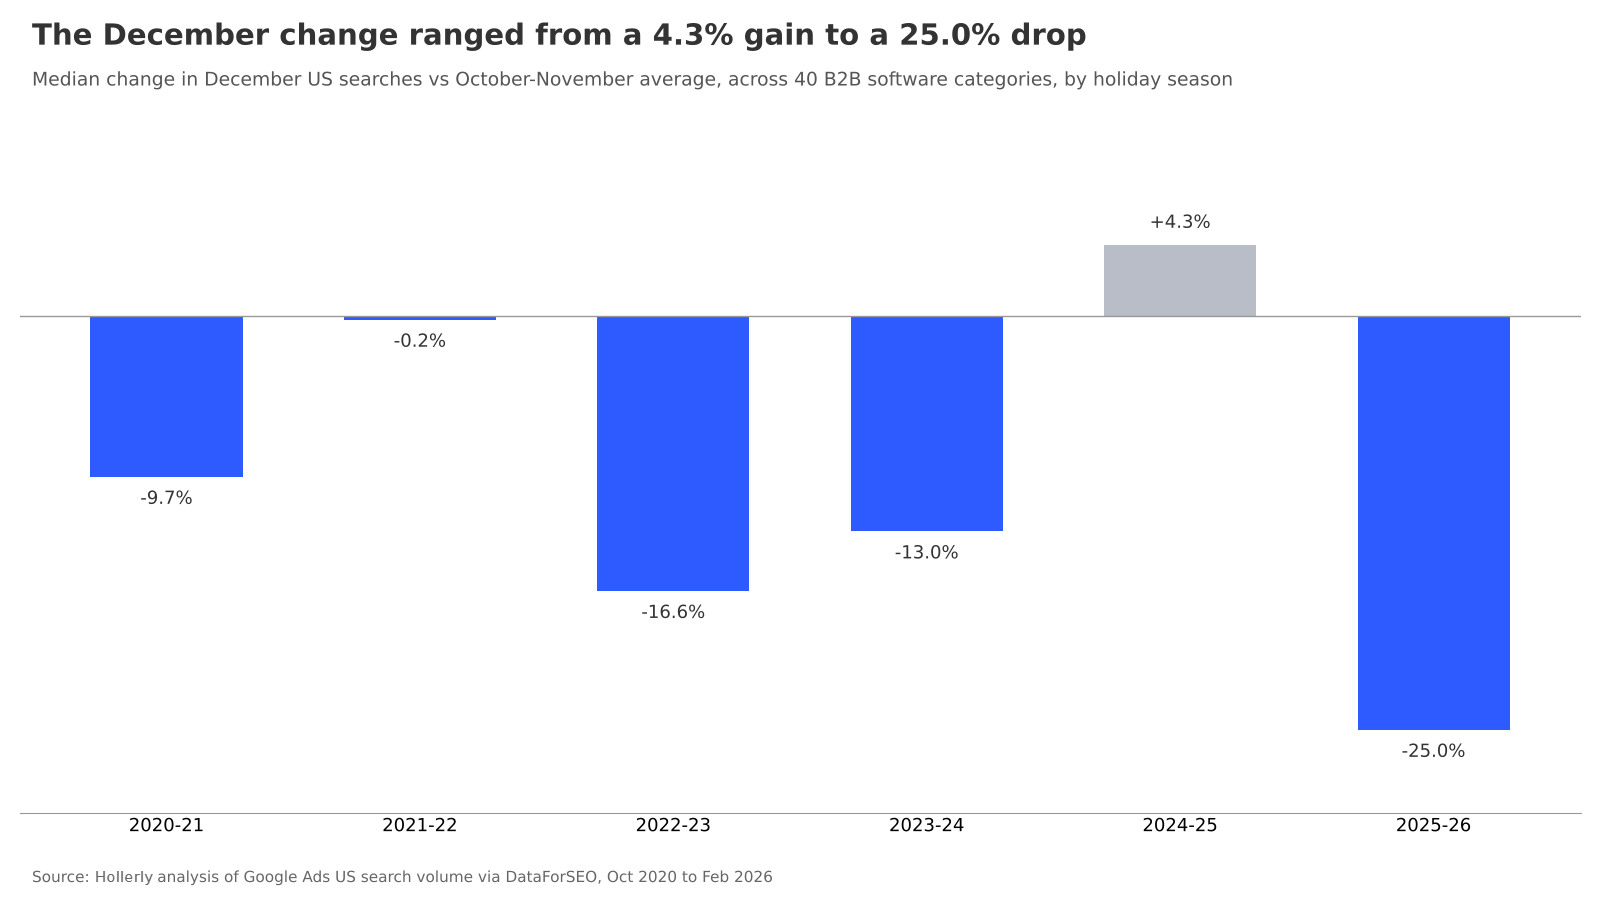
| Holiday season | Median Dec vs Oct-Nov | Median Jan vs Oct-Nov | Categories with Dec below Oct-Nov (of 40) | Categories with Jan above Dec (of 40) |
|---|---|---|---|---|
| 2020-21 | -9.7% | +4.6% | 30 | 29 |
| 2021-22 | -0.2% | +20.8% | 20 | 33 |
| 2022-23 | -16.6% | +5.1% | 34 | 34 |
| 2023-24 | -13.0% | +24.0% | 33 | 39 |
| 2024-25 | +4.3% | +31.5% | 15 | 32 |
| 2025-26 | -25.0% | -11.7% | 34 | 25 |
Which categories dip most
Taking each category's median across the six seasons, 32 of 40 categories show a December decline. The deepest typical dips are in live chat (-23.1%) and contract management (-21.3%) software. A few categories typically gain in December, led by AI writing (+17.2%) and accounting (+6.6%).
What this means for sellers
December is a softer month for software research, not a dead one. Most of the volume is still there, and January demand typically runs above the fall. Outreach that keeps going through December, then ramps in early January, lines up with how buyers search.
If you plan to keep prospects warm through the holidays, Hollerly's LinkedIn message automation tool keeps follow-ups going on LinkedIn and email while the team is out, and stops when someone replies.
About the data
- Data: monthly US Google search volume (English) for six holiday seasons, October 2020 to February 2026.
- Sample: 40 B2B software categories represented by 114 generic keywords ("[category] software", "best [category] software", "[category] tools") with a complete monthly series for the period. No brand names.
- Calculation: for each category and season, December, January and February searches compared with the average of that October and November. Results are medians across categories so that no single large category (password managers make up most of the raw volume) drives the result. 240 category-seasons in total.
- Monthly, not daily: monthly search volume measures the month as a whole. A short dip in the last week of December is spread across the month, so this study cannot say how deep the Christmas-week drop is or how many days recovery takes.
- Spikes: isolated one-month values more than 4 times a keyword's centered 7-month rolling median are replaced with that median.
- Limitations: search volumes are rounded estimates, and small keywords move in coarse steps. Search is a proxy for buying research, not purchases.
Sources
- US Google search volume (English), monthly, October 2020 to February 2026
Source: Hollerly, The Holiday Slump Myth in B2B, October 2026. https://hollerlyai.com/research/b2b-holiday-slump
Charts and data are free to use under CC BY 4.0 with a link to this page. Press questions: hello@hollerlyai.com