66.6% of US Manufacturing Shipments Were E-Commerce in 2024
How much B2B selling now happens online: a Census data study by Hollerly. Published October 2026.
Key findings
- E-commerce accounted for 66.6% of US manufacturing shipments in 2024, or $4.65 trillion of $6.98 trillion.
- Merchant wholesalers booked 38.3% of their 2024 sales through e-commerce, worth $4.22 trillion.
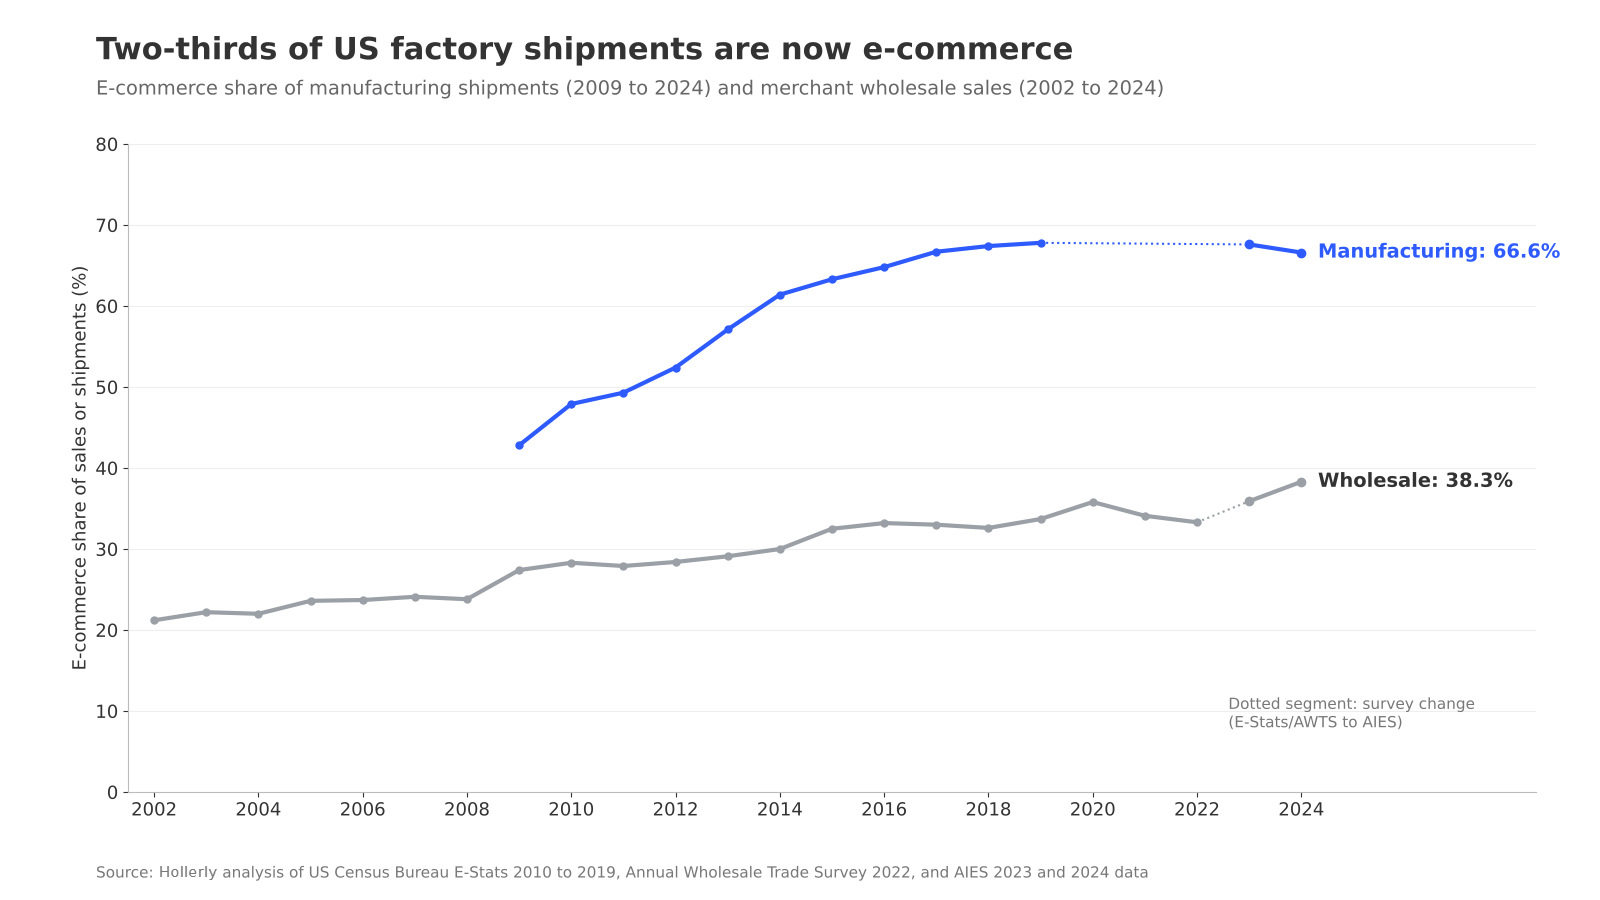
- The e-commerce share of manufacturing shipments rose from 42.8% in 2009 to 67.8% in 2019.
- The e-commerce share of merchant wholesale sales climbed from 21.2% in 2002 to 38.3% in 2024.
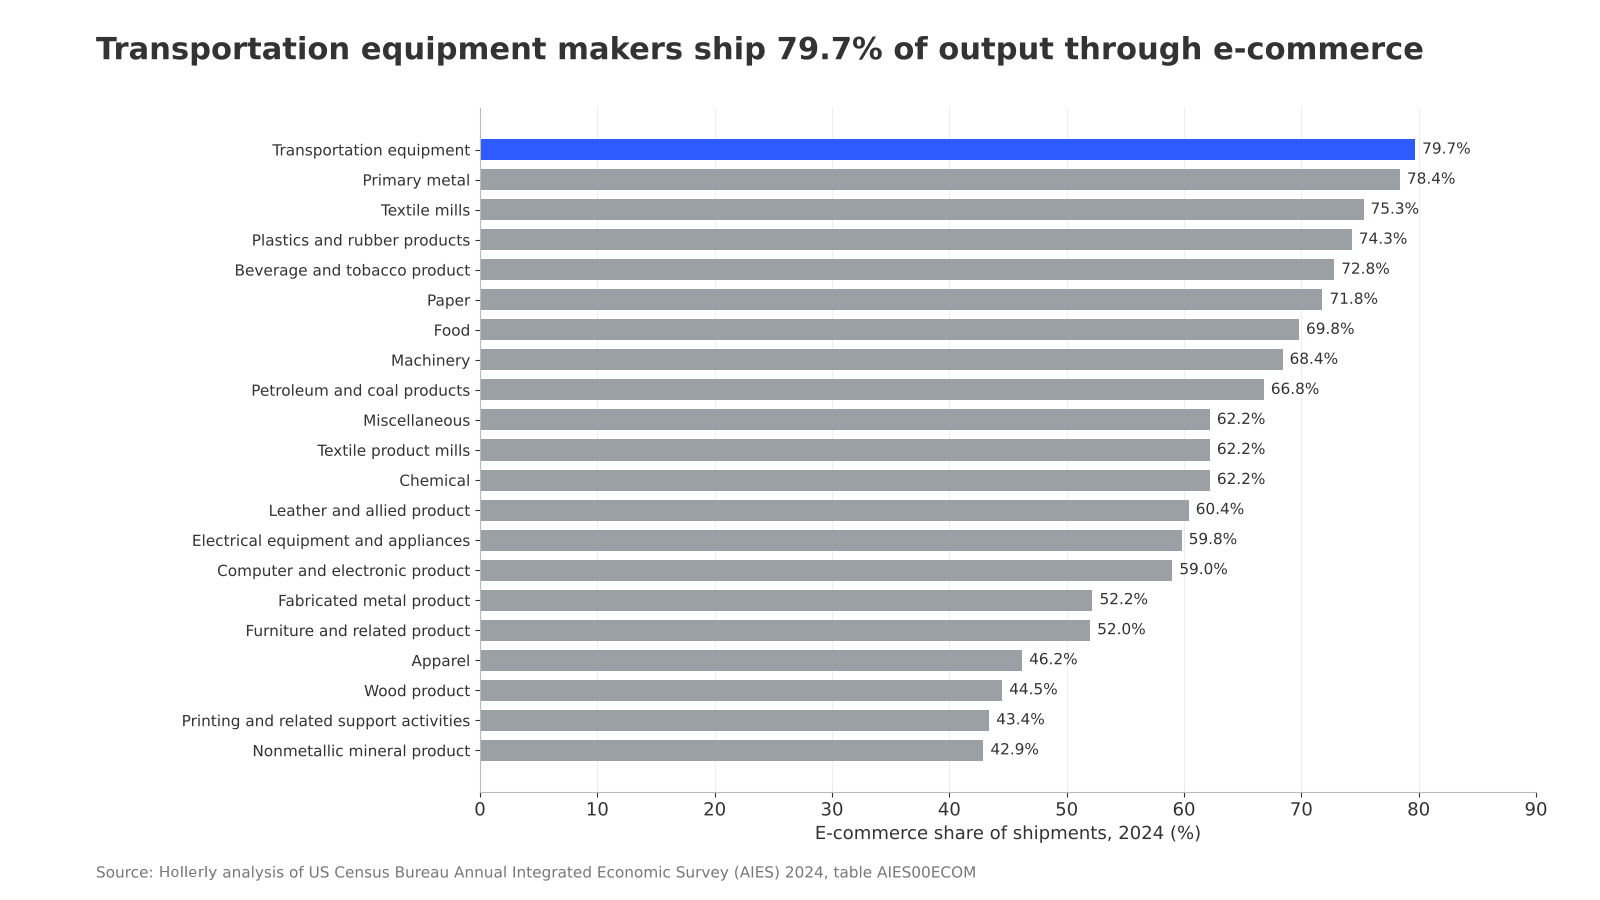
- Transportation equipment makers had the highest e-commerce share of any manufacturing subsector in 2024, at 79.7% of shipments.
- Manufacturers' sales branches and offices sold 46.8% online in 2024, compared with 35.1% for independent merchant wholesalers.
- For comparison, e-commerce made up 16.6% of US retail trade sales in 2024, according to the same Census survey.
B2B buying moved online long before consumer shopping did
Most coverage of e-commerce focuses on retail. The larger shift happened between businesses. In 2024, US manufacturers shipped $4.65 trillion worth of goods through e-commerce channels, 66.6% of all manufacturing shipments. Merchant wholesalers added another $4.22 trillion in e-commerce sales, 38.3% of their total.
The Census Bureau counts a sale as e-commerce when the order, price and terms are agreed over a computer network. That covers websites and online marketplaces, and also EDI (electronic data interchange) and other system-to-system ordering, which carries much of the volume in manufacturing.
Manufacturing crossed the halfway mark around 2012
In 2009, 42.8% of manufacturing shipments were e-commerce. By 2012 that share had reached 52.4%, and by 2019 it was 67.8%. Published E-Stats tables end with 2019 data. The Census Bureau now reports e-commerce through its Annual Integrated Economic Survey (AIES). AIES put the share at 67.6% in 2023 and 66.6% in 2024. Because the two surveys use different methods, the gap between 2019 and 2023 should be read as a series break rather than a measured change.
The plateau matters for sales teams. Two-thirds of factory output already moves through digital ordering, while the wholesale share has kept rising in the most recent data.
Wholesale is still climbing
Merchant wholesale e-commerce has grown more steadily. The share was 21.2% in 2002, 28.4% in 2012 and 33.3% in 2022 under the Annual Wholesale Trade Survey. The AIES figures for 2023 (35.9%) and 2024 (38.3%) continue that upward path, with the same caution about the change in survey.
Within wholesale, manufacturers' own sales branches and offices sell more online (46.8% in 2024) than independent merchant wholesalers (35.1%).
| Year | Manufacturing e-commerce share | Merchant wholesale e-commerce share |
|---|---|---|
| 2009 | 42.8% | 27.4% |
| 2014 | 61.4% | 30.0% |
| 2019 | 67.8% | 33.7% |
| 2022 | n/a | 33.3% |
| 2023 | 67.6% | 35.9% |
| 2024 | 66.6% | 38.3% |
Which industries sell the most online
Transportation equipment manufacturing led all manufacturing subsectors in 2024, with 79.7% of shipments sold through e-commerce. Primary metals (78.4%) and textile mills (75.3%) followed. At the other end, nonmetallic mineral products (42.9%), printing (43.4%) and wood products (44.5%) still sell most of their output through offline channels.
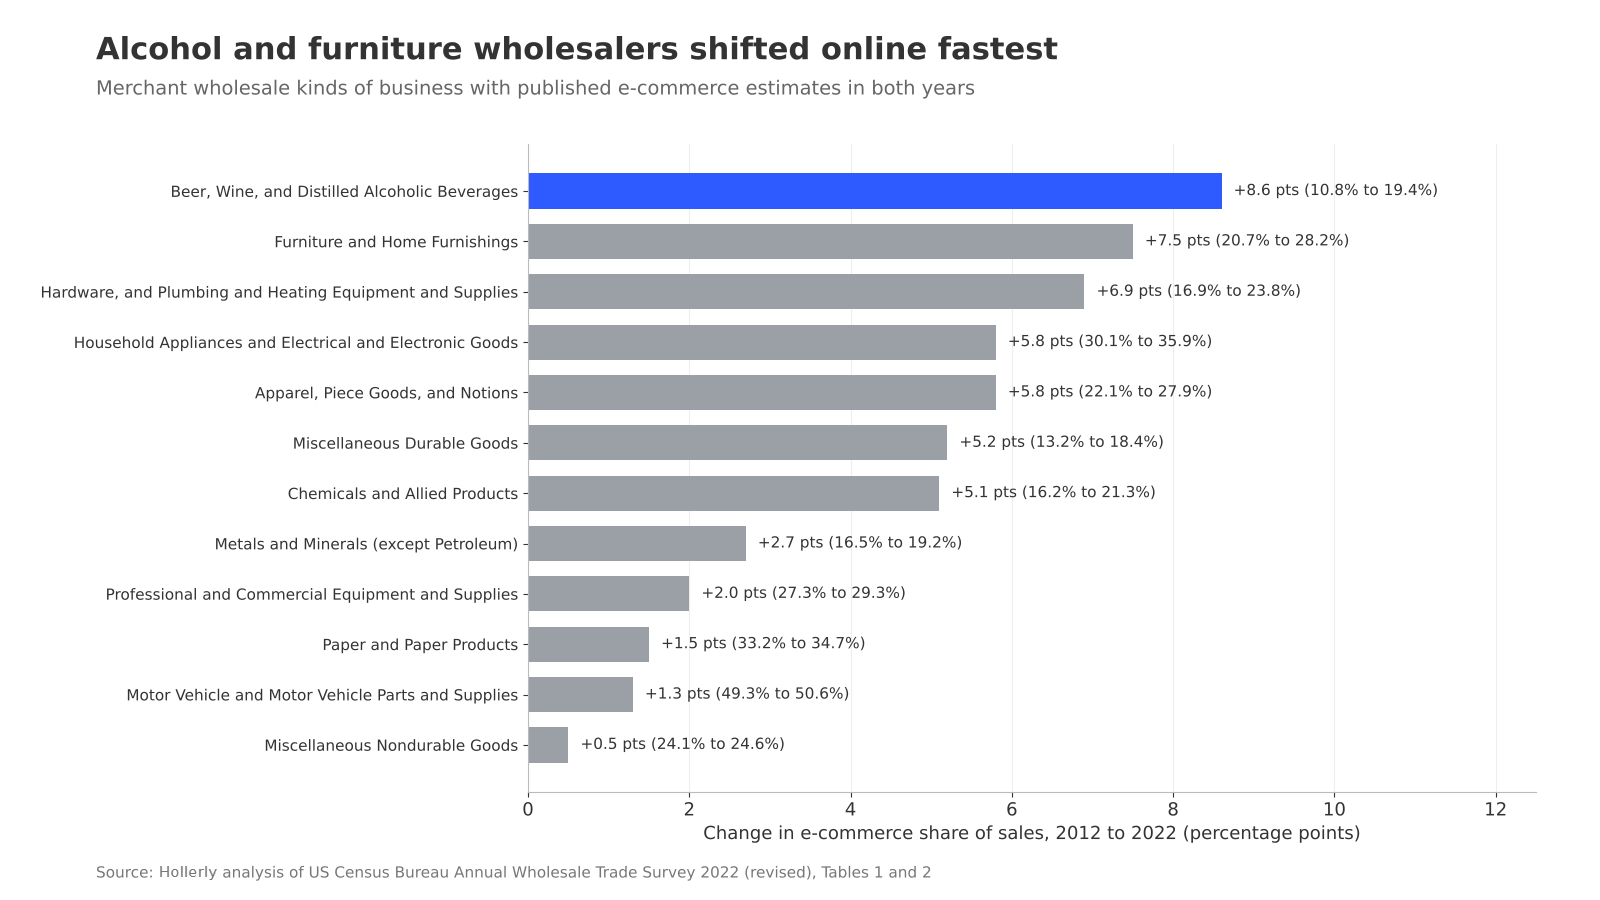
In wholesale, the biggest moves between 2012 and 2022 came in categories that started with low digital adoption. Beer, wine and spirits wholesalers went from 10.8% to 19.4% e-commerce, a gain of 8.6 percentage points. Furniture and home furnishings wholesalers rose 7.5 points to 28.2%, and hardware, plumbing and heating suppliers rose 6.9 points to 23.8%.
What this means for B2B sellers
When most repeat transactions run through digital ordering, the work that still needs a salesperson sits earlier in the cycle: finding new accounts, opening conversations and winning the first order. The subsectors with the lowest e-commerce shares, such as nonmetallic minerals, printing and wood products, still complete more than half of their sales through other channels.
Hollerly's LinkedIn lead generation automation turns a LinkedIn search into AI-written messages and email follow-ups that stop when someone replies.
About the data
- Sources: US Census Bureau E-Stats reports (data years 2009 to 2019, manufacturing Table 1), the Annual Wholesale Trade Survey (AWTS) 2022 revised Tables 1 and 2 (data years 2002 to 2022), and the Annual Integrated Economic Survey (AIES) 2023 and 2024 table AIES00ECOM (released September 2025 and the latest available).
- Manufacturing series: e-commerce value of shipments divided by total value of shipments. Each year uses the most recent published revision (the prior-year column of the following year's E-Stats table where available). E-Stats data for 2020 to 2022 were not published, so the chart shows a gap.
- Wholesale series: AWTS e-commerce sales divided by AWTS total sales for NAICS 42 merchant wholesalers including manufacturers' sales branches and offices (MSBOs). AIES figures are the published e-commerce percent for the same type of operation.
- Industry detail: manufacturing subsectors use AIES 2024 three-digit NAICS shares. The wholesale change chart includes only kinds of business with published (not suppressed) e-commerce estimates in both 2012 and 2022.
- Limitations: E-Stats/AWTS and AIES are different surveys with different sample designs, so the 2019 to 2023 (manufacturing) and 2022 to 2023 (wholesale) comparisons are series breaks. Values are not adjusted for inflation. The 2022 AWTS e-commerce total for NAICS 42 carries a Census quality flag (total quantity response rate of 40.4%). Manufacturing shipments and wholesale sales overlap in part and should not be added together.
Sources
- US Census Bureau, E-Stats data tables: census.gov/programs-surveys/e-stats/data/tables.html
- US Census Bureau, E-Stats 2019 Table 1.0: www2.census.gov/programs-surveys/e-stats/tables/2019/table_1.0.xlsx
- US Census Bureau, Annual Wholesale Trade Survey 2022 revised, Table 2: www2.census.gov/programs-surveys/awts/tables/2022revised/2022_awts_ecom_table2.xlsx
- US Census Bureau, Annual Wholesale Trade Survey 2022 revised, Table 1: www2.census.gov/programs-surveys/awts/tables/2022revised/2022_awts_sales_table1.xlsx
- US Census Bureau, AIES 2024 AIES00ECOM: www2.census.gov/programs-surveys/aies/data/2024/AIES00ECOM.zip
- US Census Bureau, AIES 2023 AIES00ECOM: www2.census.gov/programs-surveys/aies/data/2023/AIES00ECOM.zip
Source: Hollerly, How much B2B selling now happens online, October 2026. https://hollerlyai.com/research/b2b-ecommerce-share
Charts and data are free to use under CC BY 4.0 with a link to this page. Press questions: hello@hollerlyai.com