Buyers search "[brand] pricing" 9.5x more than "[brand] reviews"
What B2B Buyers Search Before They Buy Software: a search data study by Hollerly. Published October 2026.
Key findings
- Across 50 B2B software brands, US buyers search "[brand] pricing" 9.5 times as often as "[brand] reviews".
- For the median brand, pricing searches outnumber review searches 7.0 to 1.
- Pricing searches beat review searches for every one of the 50 brands studied.
- "Pricing" is the most-searched modifier for 49 of 50 brands; for the remaining brand it was "alternatives".
- Pricing accounts for 73.4% of all modifier searches we measured, followed by alternatives at 11.9%.
- "[brand] alternatives" searches outnumber "[brand] reviews" for 31 of 50 brands.
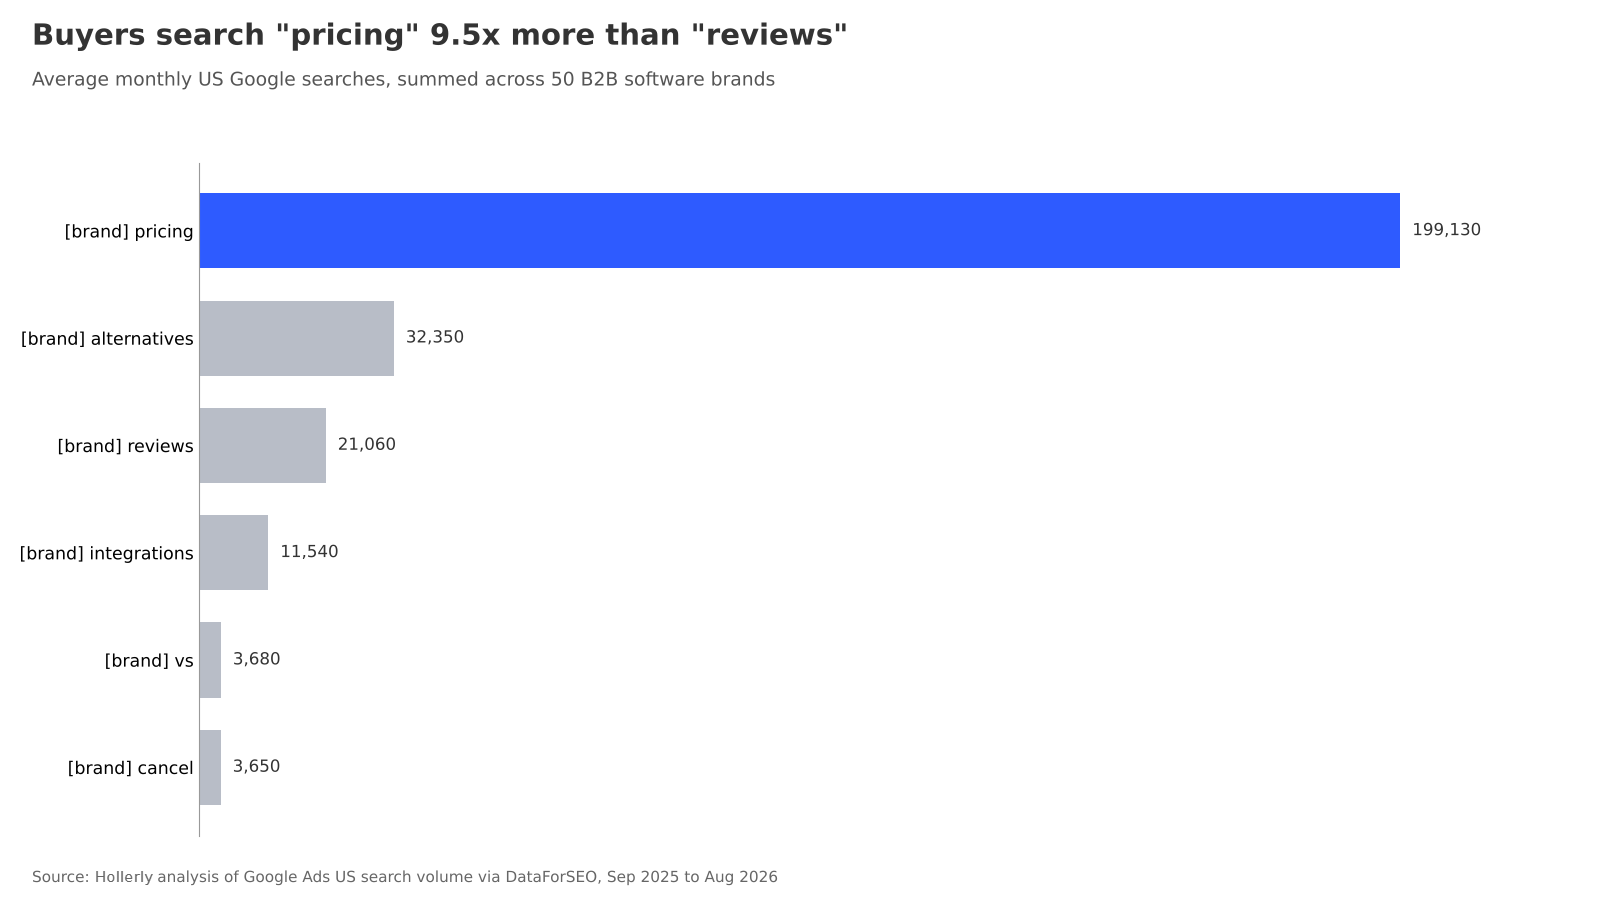
- "[brand] pricing" draws 199,130 US searches a month across the 50 brands, against 21,060 for reviews.
Price comes first
Before buyers book a demo, they search. We measured what they add to a software brand's name when they do, using US Google search volume for 50 well-known B2B software brands across CRM, project management, marketing, finance and HR, collaboration, and support and ecommerce tools. For each brand we looked at six modifiers: pricing, alternatives, reviews, integrations, vs and cancel.
Pricing wins by a wide margin. Summed across all 50 brands, "[brand] pricing" draws 199,130 searches a month. "[brand] reviews" draws 21,060, a ratio of 9.5 to 1. The pattern holds brand by brand: pricing searches beat review searches for every brand in the sample, and the median brand sees 7.0 pricing searches for each review search.
| Modifier | Monthly searches (50 brands) | Share | Median per brand | Brands where it is the top modifier |
|---|---|---|---|---|
| [brand] pricing | 199,130 | 73.4% | 2,400 | 49 |
| [brand] alternatives | 32,350 | 11.9% | 480 | 1 |
| [brand] reviews | 21,060 | 7.8% | 260 | 0 |
| [brand] integrations | 11,540 | 4.3% | 155 | 0 |
| [brand] vs | 3,680 | 1.4% | 50 | 0 |
| [brand] cancel | 3,650 | 1.3% | 30 | 0 |
Alternatives are the second question
After price, buyers look at what else is out there. "Alternatives" searches add up to 32,350 a month, more than reviews, and outnumber review searches for 31 of the 50 brands. Pricing still draws 6.2 times as many searches as alternatives.
Integrations, comparisons and cancellations
The remaining modifiers draw far less volume. "Integrations" searches total 11,540 a month across the 50 brands, a sign that some buyers check fit with their existing stack before buying. The bare "[brand] vs" phrase draws 3,680, and "[brand] cancel" 3,650, with no measurable volume for half the brands.
The pattern holds across categories
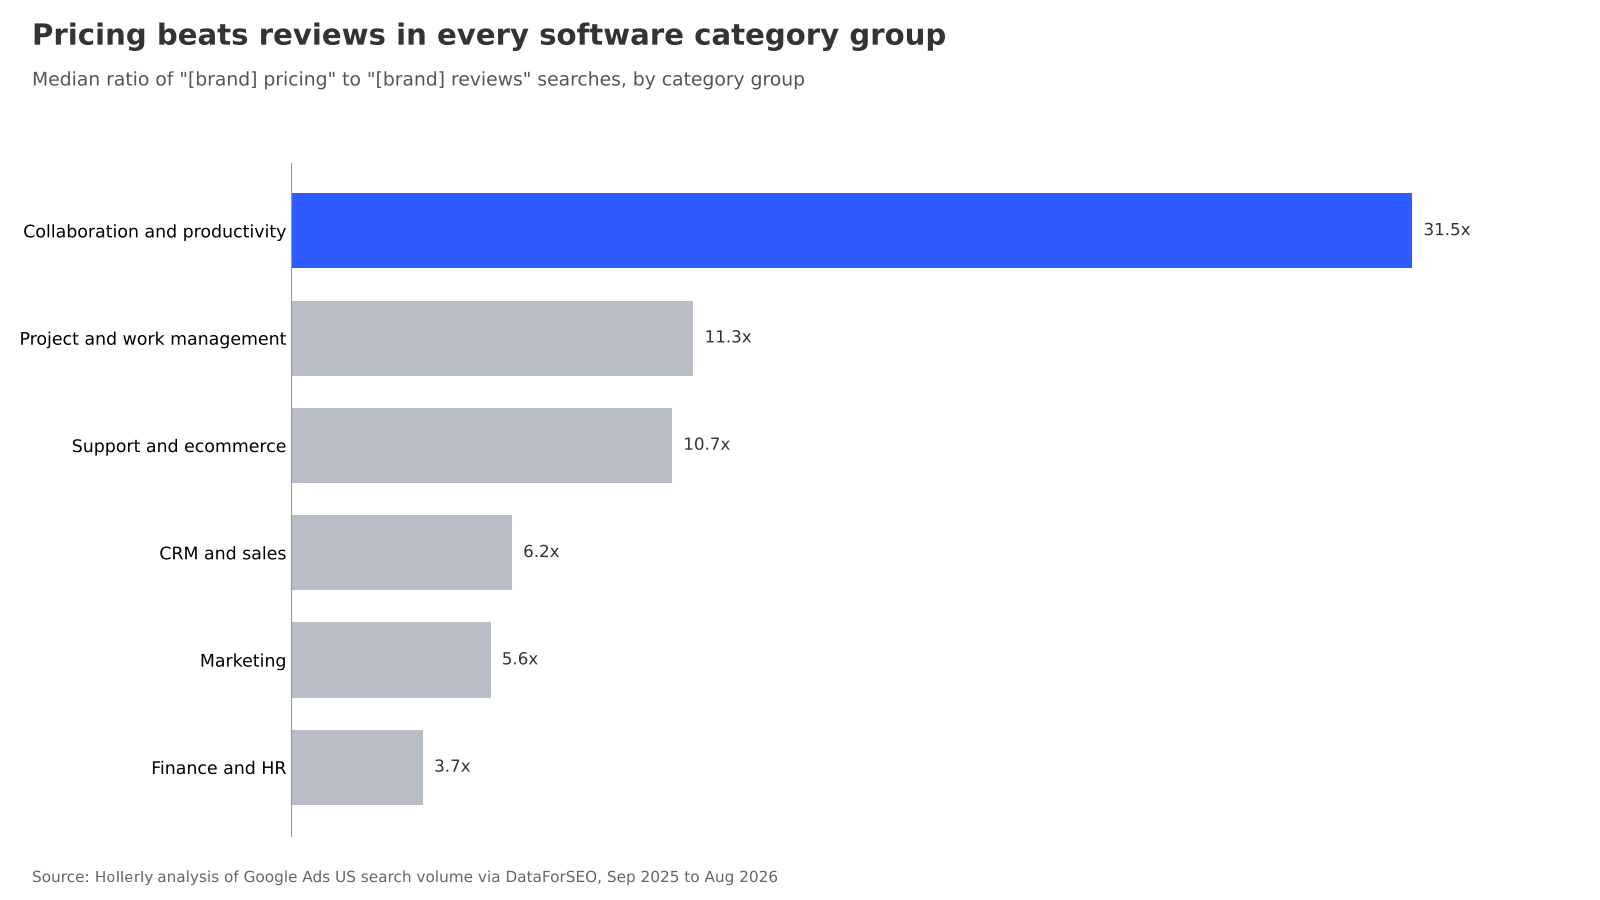
We grouped the brands into six category groups. In each one, the median brand gets more pricing searches than review searches.
What this means for sellers
Buyers who search a brand name plus "pricing" are often comparing cost before they talk to anyone. Outreach and landing pages that are clear about price, packaging and how a product compares with alternatives match what buyers look for first. Review content still matters, but it draws far less direct search demand.
If you sell software, put price where buyers look first. A clear pricing page and an honest comparison with alternatives answer the two questions buyers search most. Hollerly's own pricing page sets its plans, from $19 a month, next to free LinkedIn automation tools.
About the data
- Data: average monthly US Google search volume (English), September 2025 to August 2026.
- Sample: 50 B2B software brands in six category groups (CRM and sales; project and work management; marketing; finance and HR; collaboration and productivity; support and ecommerce), each combined with six modifiers: pricing, alternatives, reviews, integrations, vs and cancel, plus the brand name alone. 350 keywords. This edition covers 50 brands and the six most common buying modifiers.
- Calculation: modifier totals are summed across brands. Ratios per brand divide pricing searches by reviews searches. Medians are used to limit the effect of the largest brands.
- Missing data: 25 "[brand] cancel" keywords and 1 "[brand] vs" keyword have no measurable search volume and are left out of medians.
- Limitations: some brand names are common words (for example Zoom, Slack, Notion), so modifier searches can include non-software intent. "[brand] vs" only captures the bare phrase, not full comparisons such as "[brand] vs [competitor]", so it understates comparison searches. Search volumes are rounded estimates. Results are aggregate; no brand is ranked.
Sources
- US Google search volume (English), average monthly searches, September 2025 to August 2026
Source: Hollerly, What B2B Buyers Search Before They Buy Software, October 2026. https://hollerlyai.com/research/b2b-buyer-pre-purchase-searches
Charts and data are free to use under CC BY 4.0 with a link to this page. Press questions: hello@hollerlyai.com