Akron, OH Is the Best Place to Be a B2B Sales Rep in 2026
Best US metros to be a B2B sales rep. Published October 2026.
Hollerly analysis of BLS OEWS May 2025 wages and Census ACS 2024 rents
Key findings
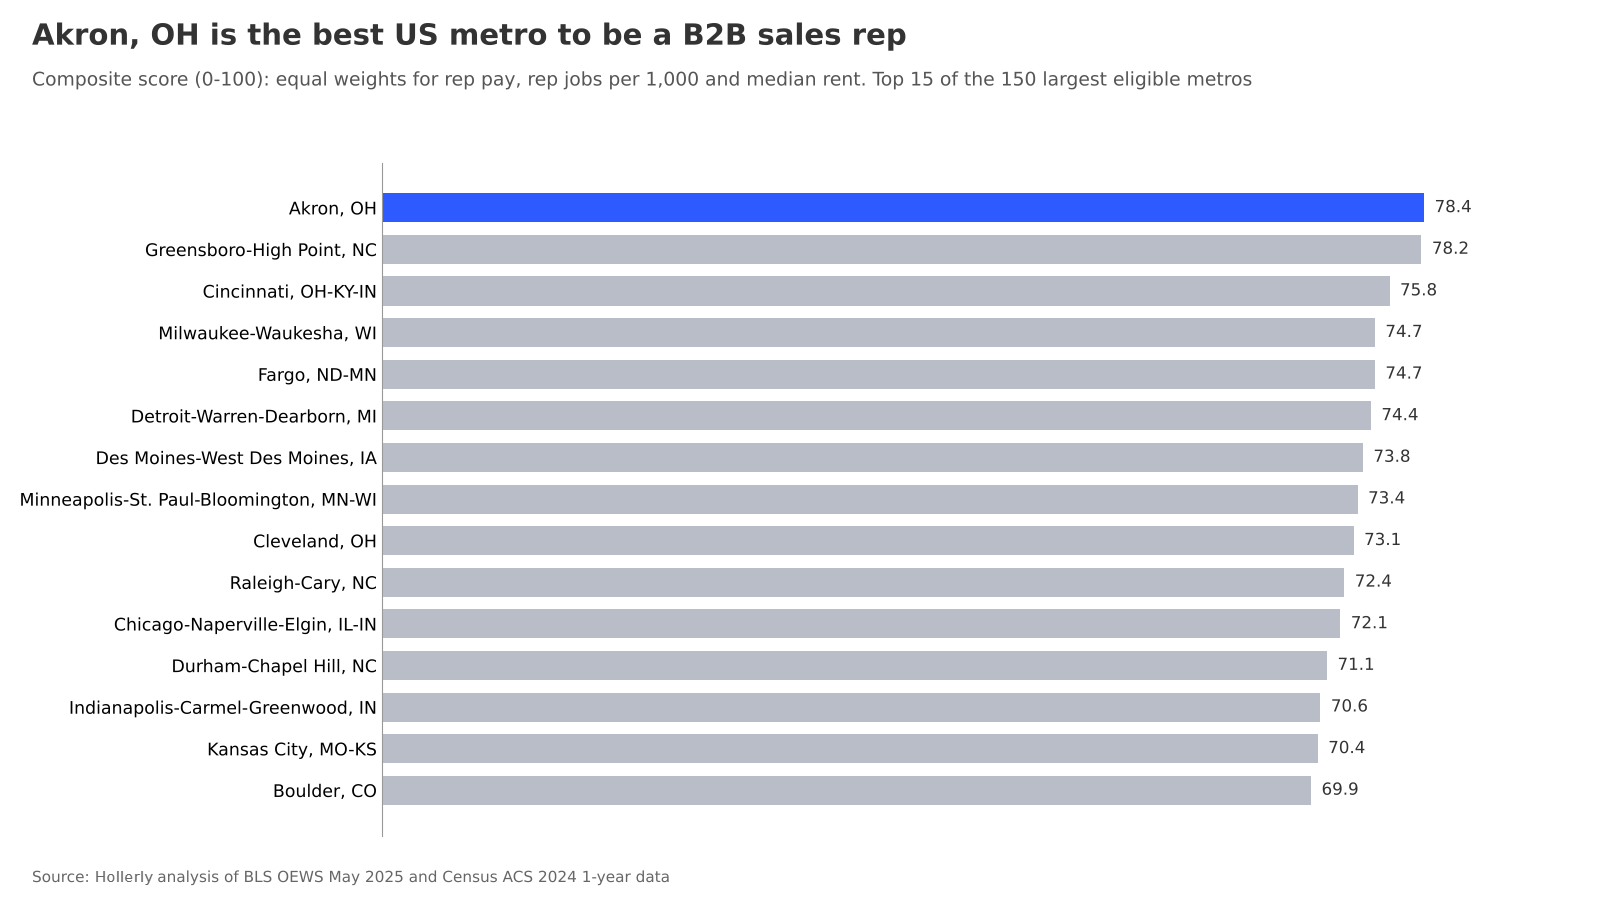
- Akron, OH is the best US metro to be a B2B sales rep, with a composite score of 78.4 out of 100.
- B2B sales reps in Akron, OH average $79,894 a year, with 21.8 rep jobs per 1,000 and median rent of $1,059 a month.
- San Jose-Sunnyvale-Santa Clara, CA pays B2B sales reps the most of the 150 metros studied, averaging $129,829.
- Boulder, CO has the highest concentration of B2B sales rep jobs, 28.1 per 1,000 jobs, versus 17.9 nationally.
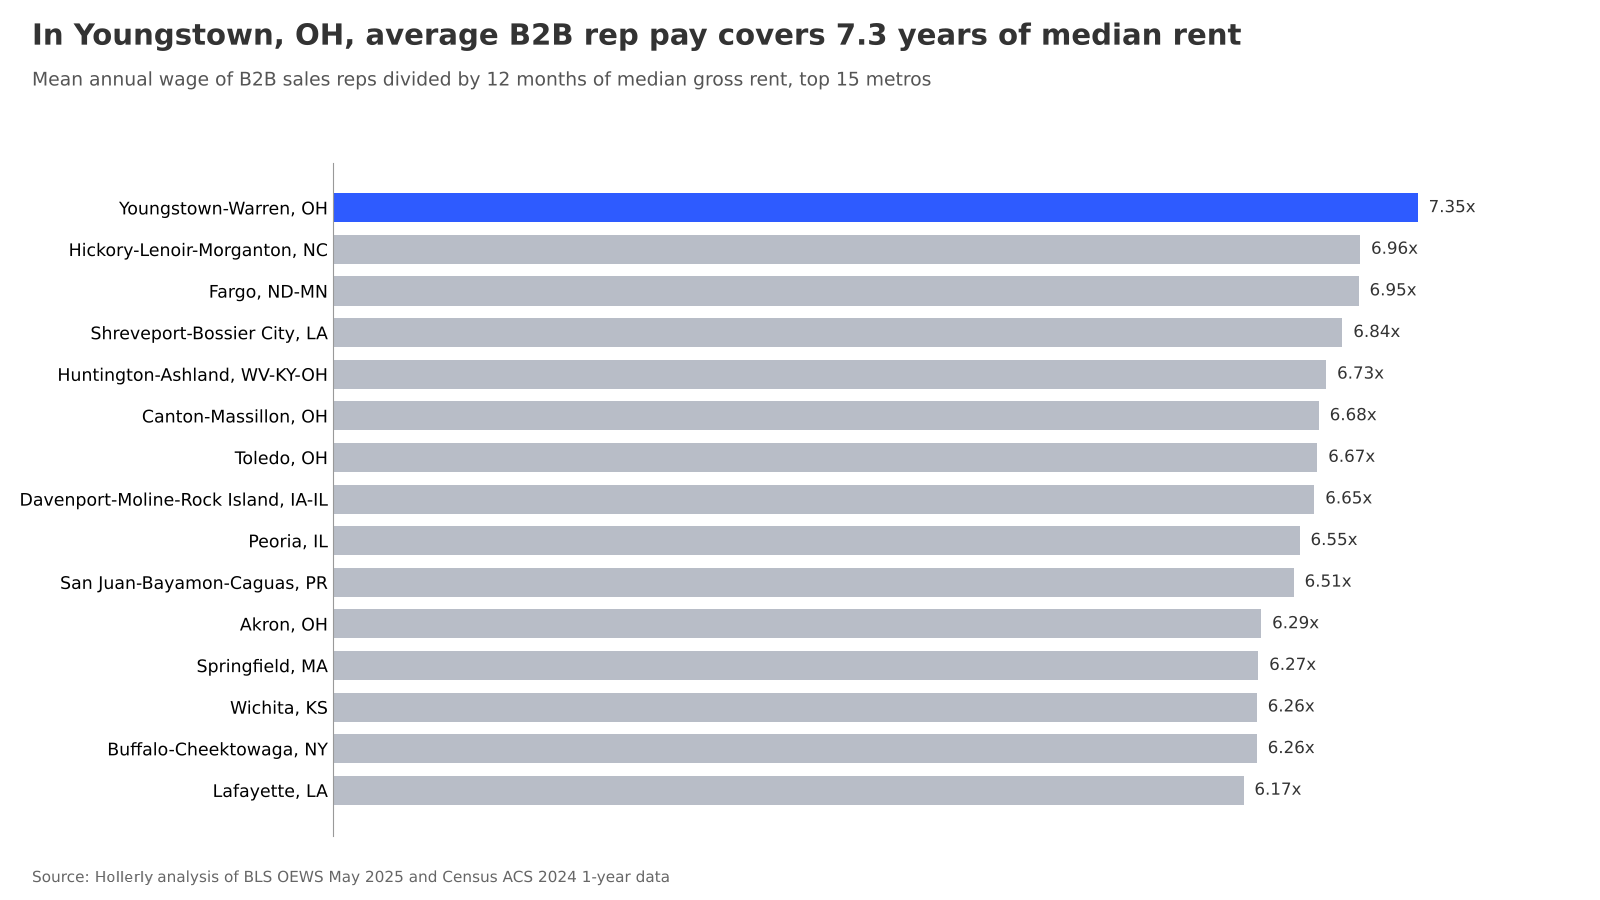
- In Youngstown-Warren, OH, the average B2B rep salary equals 7.35 years of median rent, the best ratio of any large metro.
- Among the 10 largest US job markets, Chicago-Naperville-Elgin, IL-IN ranks highest, at number 11 overall.
The ranking
High pay matters, but so does what that pay buys and how many local employers are hiring reps. We scored the 150 largest US metro areas with publishable data on three measures with equal weight: the average wage of B2B sales reps, the number of B2B rep jobs per 1,000 jobs, and median gross rent.
Akron, OH comes out on top. Reps there average $79,894 against a national average of $86,297, the metro has 21.8 rep jobs per 1,000 (national: 17.9), and median rent is $1,059.
| Rank | Metro | Score | Mean wage | Reps per 1,000 jobs | Median rent |
|---|---|---|---|---|---|
| 1 | Akron, OH | 78.4 | $79,894 | 21.8 | $1,059 |
| 2 | Greensboro-High Point, NC | 78.2 | $83,973 | 21.1 | $1,171 |
| 3 | Cincinnati, OH-KY-IN | 75.8 | $83,263 | 21.0 | $1,203 |
| 4 | Milwaukee-Waukesha, WI | 74.7 | $80,459 | 22.5 | $1,177 |
| 5 | Fargo, ND-MN | 74.7 | $83,181 | 17.5 | $997 |
| 6 | Detroit-Warren-Dearborn, MI | 74.4 | $91,945 | 18.0 | $1,248 |
| 7 | Des Moines-West Des Moines, IA | 73.8 | $82,672 | 20.6 | $1,178 |
| 8 | Minneapolis-St. Paul-Bloomington, MN-WI | 73.4 | $90,908 | 20.1 | $1,444 |
| 9 | Cleveland, OH | 73.1 | $79,376 | 19.5 | $1,087 |
| 10 | Raleigh-Cary, NC | 72.4 | $91,391 | 27.0 | $1,674 |
| 11 | Chicago-Naperville-Elgin, IL-IN | 72.1 | $86,464 | 22.1 | $1,469 |
| 12 | Durham-Chapel Hill, NC | 71.1 | $101,840 | 20.2 | $1,598 |
| 13 | Indianapolis-Carmel-Greenwood, IN | 70.6 | $83,233 | 20.1 | $1,273 |
| 14 | Kansas City, MO-KS | 70.4 | $85,489 | 19.3 | $1,315 |
| 15 | Boulder, CO | 69.9 | $107,803 | 28.1 | $1,966 |
| 16 | Charlotte-Concord-Gastonia, NC-SC | 69.8 | $86,053 | 23.9 | $1,594 |
| 17 | Louisville/Jefferson County, KY-IN | 69.6 | $80,898 | 18.4 | $1,140 |
| 18 | Hickory-Lenoir-Morganton, NC | 69.3 | $78,042 | 17.9 | $934 |
| 19 | Shreveport-Bossier City, LA | 69.1 | $81,273 | 16.3 | $990 |
| 20 | Denver-Aurora-Centennial, CO | 68.6 | $97,035 | 28.1 | $1,943 |
| 21 | Green Bay, WI | 68.0 | $74,277 | 21.7 | $1,052 |
| 22 | Atlanta-Sandy Springs-Roswell, GA | 66.4 | $88,102 | 22.6 | $1,770 |
| 23 | Spartanburg, SC | 66.0 | $83,502 | 16.1 | $1,139 |
| 24 | Austin-Round Rock-San Marcos, TX | 65.8 | $87,066 | 24.2 | $1,784 |
| 25 | Rochester, NY | 64.9 | $85,309 | 15.6 | $1,172 |
Pay versus rent
A simpler lens is how many years of median rent the average rep salary covers. Youngstown-Warren, OH leads at 7.35. At the other end, Oxnard-Thousand Oaks-Ventura, CA has the lowest ratio, 3.07.
The biggest job markets
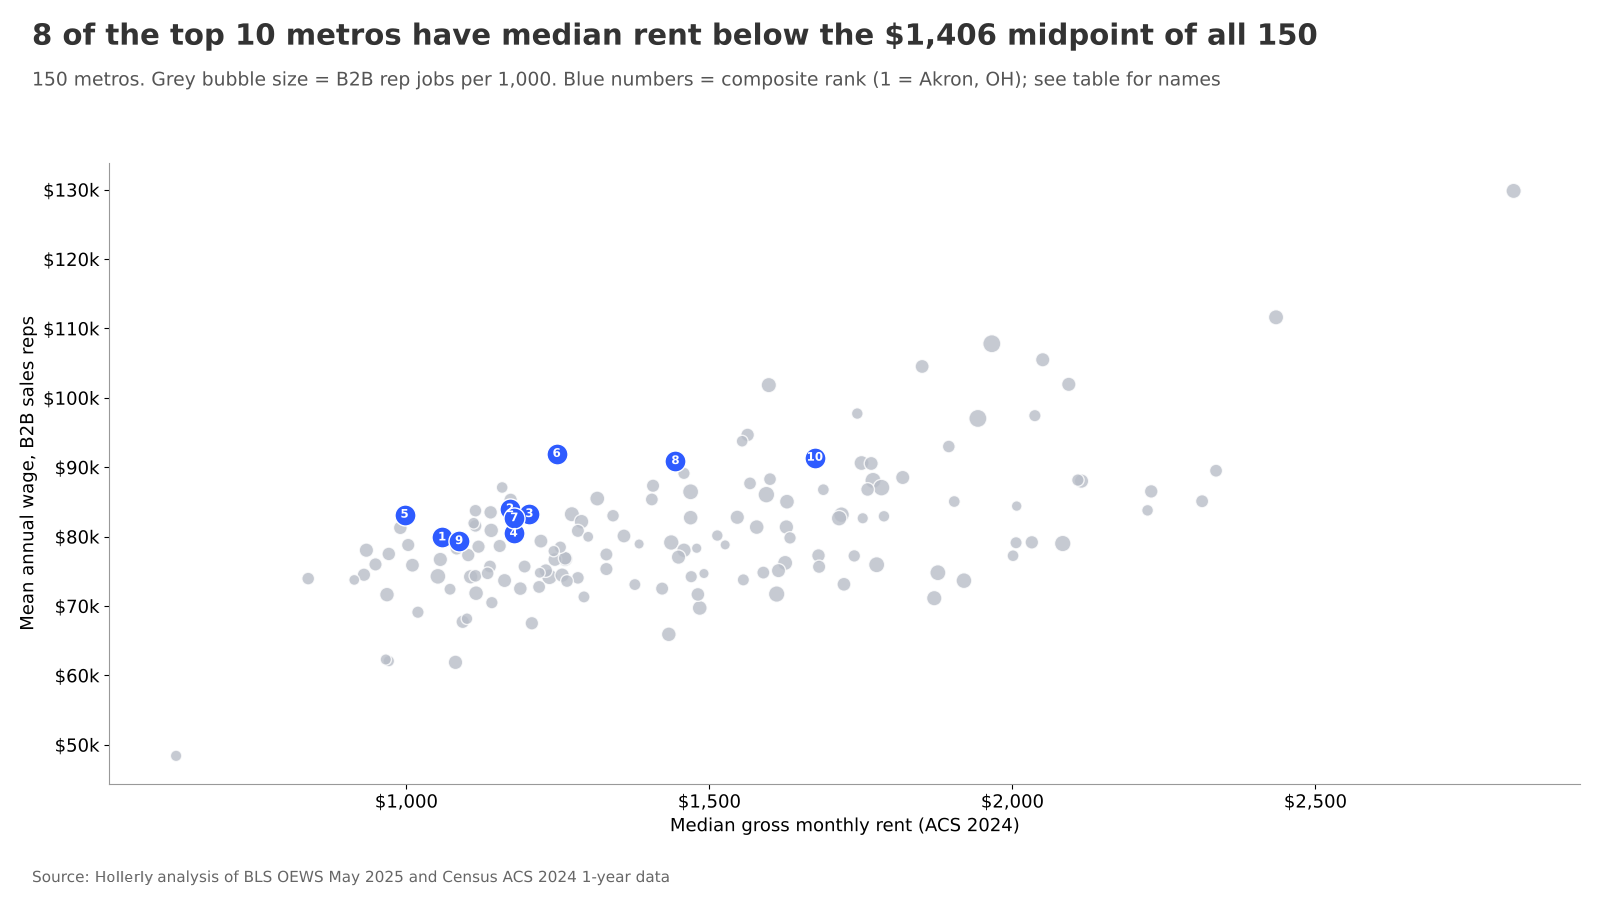
The 10 largest metros by total employment have the biggest job markets overall, but rent pulls their scores down. 9 of the 10 rank outside the top 20, and the median rent across these 10 metros is $1,810, compared with $1,406 across all 150 metros scored.
| Overall rank | Metro | Score | Mean wage | Reps per 1,000 jobs | Median rent |
|---|---|---|---|---|---|
| 11 | Chicago-Naperville-Elgin, IL-IN | 72.1 | $86,464 | 22.1 | $1,469 |
| 22 | Atlanta-Sandy Springs-Roswell, GA | 66.4 | $88,102 | 22.6 | $1,770 |
| 31 | Houston-Pasadena-The Woodlands, TX | 62.1 | $82,734 | 18.9 | $1,469 |
| 37 | Dallas-Fort Worth-Arlington, TX | 60.7 | $83,161 | 21.2 | $1,718 |
| 48 | New York-Newark-Jersey City, NY-NJ | 57.8 | $104,527 | 17.0 | $1,851 |
| 58 | Boston-Cambridge-Newton, MA-NH | 55.8 | $101,949 | 17.8 | $2,093 |
| 73 | Los Angeles-Long Beach-Anaheim, CA | 51.4 | $88,000 | 17.8 | $2,114 |
| 75 | Miami-Fort Lauderdale-West Palm Beach, FL | 51.1 | $79,006 | 23.3 | $2,083 |
| 77 | Philadelphia-Camden-Wilmington, PA-NJ-DE-MD | 50.8 | $87,672 | 14.5 | $1,567 |
| 104 | Washington-Arlington-Alexandria, DC-VA-MD-WV | 40.9 | $97,438 | 13.1 | $2,037 |
To reach these buyers directly, Hollerly's LinkedIn prospecting software finds the right people on LinkedIn and writes each first message with AI.
About the data
- Pay and jobs: U.S. Bureau of Labor Statistics, Occupational Employment and Wage Statistics (OEWS), May 2025 metropolitan area estimates, the latest release available as of 2026-10-02. "B2B sales reps" combines SOC 41-4011 (wholesale and manufacturing, technical and scientific products), 41-4012 (wholesale and manufacturing, except technical) and 41-3091 (services sales reps, except advertising, insurance, financial services and travel). Mean wage is the employment-weighted average of the three occupation means. Jobs per 1,000 is combined rep employment divided by total metro employment.
- Rent: U.S. Census Bureau, American Community Survey 2024 1-year estimates, table B25064 (median gross rent), by core-based statistical area. ACS 2025 1-year data was not yet published.
- Sample: metros ranked by total OEWS employment; the first 150 metros where all three rep occupations had published employment and mean wage (relative standard error of 20% or less) and an ACS rent estimate were scored. 10 larger metros are not scored because of missing or unreliable cells (listed in data.xlsx).
- Score: each metro gets a percentile rank on pay (higher is better), rep jobs per 1,000 (higher is better) and median rent (lower is better). The composite is the average of the three, scaled 0 to 100.
- Limitations: rent is a proxy for cost of living and ignores taxes, home prices and other costs. OEWS wages lag about one year and exclude self-employed reps. Metro definitions follow OEWS, which uses OMB core-based statistical areas.
Sources
- BLS OEWS May 2025, metropolitan area estimates: bls.gov/oes/special-requests/oesm25ma.zip
- BLS OEWS May 2025, national estimates: bls.gov/oes/special-requests/oesm25nat.zip
- Census ACS 2024 1-year, B25064 summary file: www2.census.gov/programs-surveys/acs/summary_file/2024/table-based-SF/data/1YRData/acsdt1y2024-b25064.dat
Source: Hollerly, Best US metros to be a B2B sales rep, October 2026. https://hollerlyai.com/research/best-metros-b2b-sales-reps
Charts and data are free to use under CC BY 4.0 with a link to this page. Press questions: hello@hollerlyai.com