Public Software Companies Now Spend 26.6% of Revenue on Sales and Marketing, Down From 34.1% in 2022
Sales and marketing spend at public companies, 2010 to 2025: an SEC filings study by Hollerly. Published October 2026.
Key findings
- The median public software company (SIC 7372) spent 26.6% of revenue on sales and marketing in 2025, down from 34.1% in 2022.
- Among 138 software companies that reported in both 2022 and 2025, 79.0% spent a smaller share of revenue on sales and marketing in 2025.
- Across all public software companies combined, sales and marketing expense equaled 17.3% of total revenue in 2025, compared with 21.4% in 2022 and 23.0% in 2015.
- The middle half of public software companies spent between 15.2% and 37.6% of revenue on sales and marketing in 2025.
- Across all SEC filers that report sales and marketing separately, the median ratio was 18.1% in 2025, versus 21.6% in 2019.
- Software and IT services had the largest drop of any major sector from 2019 to 2025, with the median falling from 31.7% to 27.2% of revenue.
- Only 23.6% of SEC filers with $10 million or more in revenue reported sales and marketing as its own line in 2025, compared with 85.9% of prepackaged software filers.
Software companies are spending less to sell
From 2010 through 2022, the median public software company spent between 26.9% and 34.1% of revenue on sales and marketing (S&M). The ratio peaked at 34.1% in 2022.
Since then it has fallen three years in a row: 30.2% in 2023, 28.2% in 2024 and 26.6% in 2025. That 2025 figure is the lowest median in the 16 years covered.
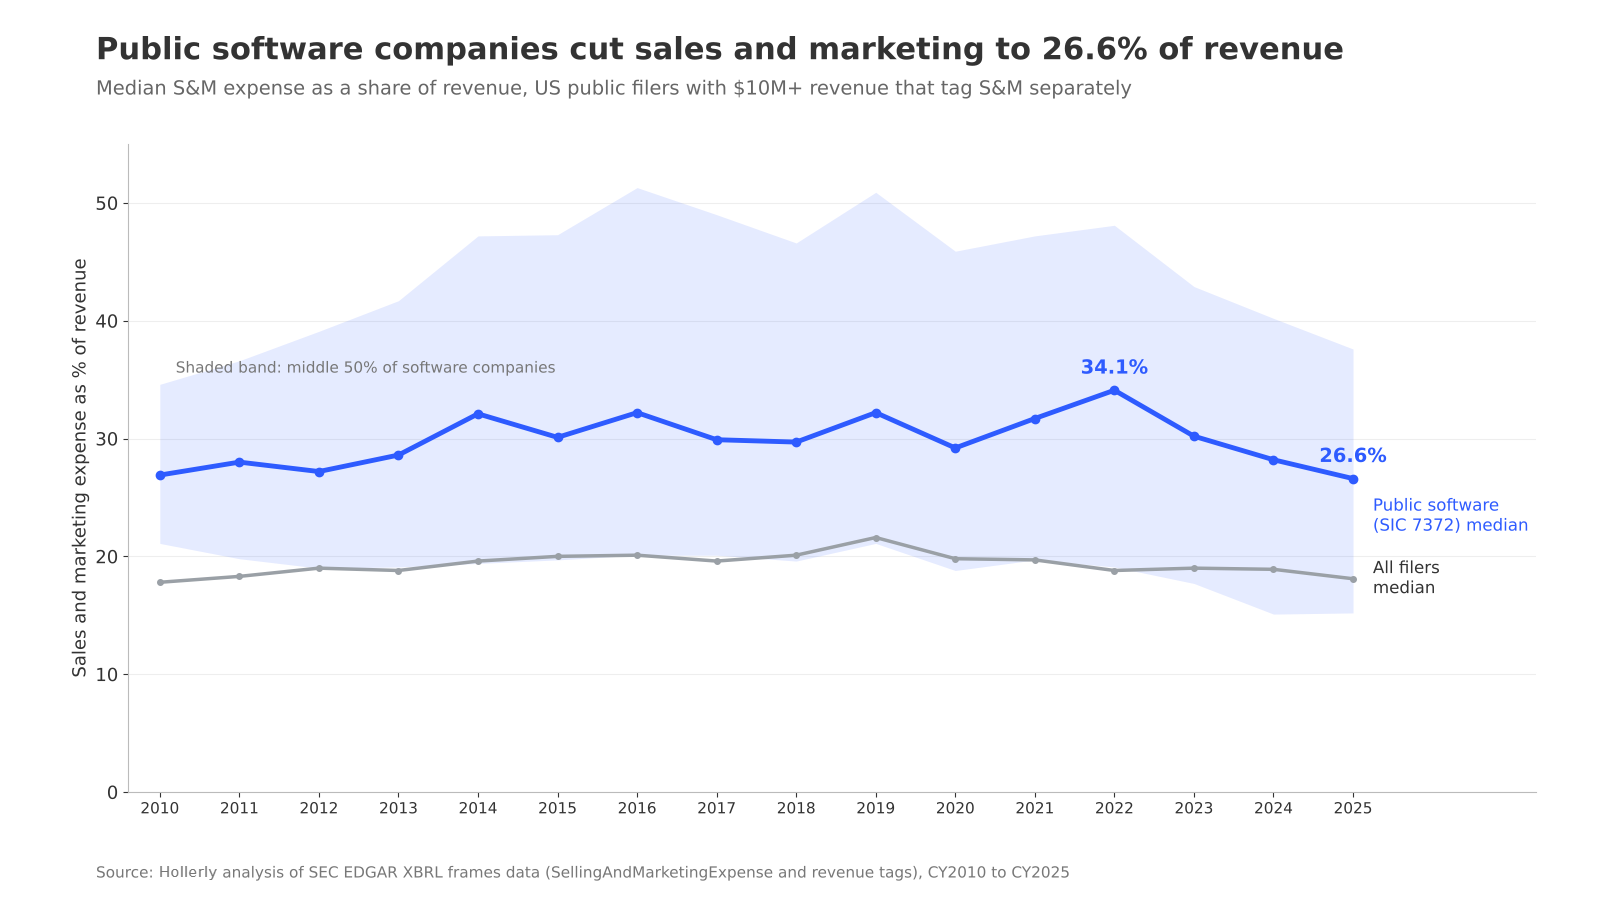
The drop is not just a change in which companies are public. Among the 138 software companies with S&M and revenue reported in both 2022 and 2025, the median ratio fell from 31.8% to 26.2%, and 79.0% of them cut S&M as a share of revenue.
| Year | Software companies (SIC 7372) | Median S&M % of revenue | 25th percentile | 75th percentile | Aggregate S&M % of revenue |
|---|---|---|---|---|---|
| 2015 | 127 | 30.1% | 19.7% | 47.3% | 23.0% |
| 2019 | 183 | 32.2% | 21.1% | 50.9% | 23.3% |
| 2021 | 188 | 31.7% | 19.7% | 47.2% | 21.5% |
| 2022 | 188 | 34.1% | 19.1% | 48.1% | 21.4% |
| 2023 | 178 | 30.2% | 17.7% | 42.9% | 19.7% |
| 2024 | 165 | 28.2% | 15.1% | 40.2% | 18.4% |
| 2025 | 152 | 26.6% | 15.2% | 37.6% | 17.3% |
The aggregate column adds up S&M and revenue across all companies in the group. It is lower than the median because the largest software companies spend a smaller share of revenue on S&M than smaller ones do.
The wider market moved less
Across every SEC filer that reports S&M as a separate line and has at least $10 million in revenue, the median ratio was 18.1% in 2025. It was 21.6% in 2019 and has stayed between 18.1% and 19.8% since 2020.
Sector by sector, software and IT services (SIC 7371, 7372 and 7374) fell the most between 2019 and 2025, from 31.7% to 27.2%. Other services fell from 22.0% to 18.6%, manufacturing from 18.4% to 16.9%, and retail trade from 16.2% to 13.7%.
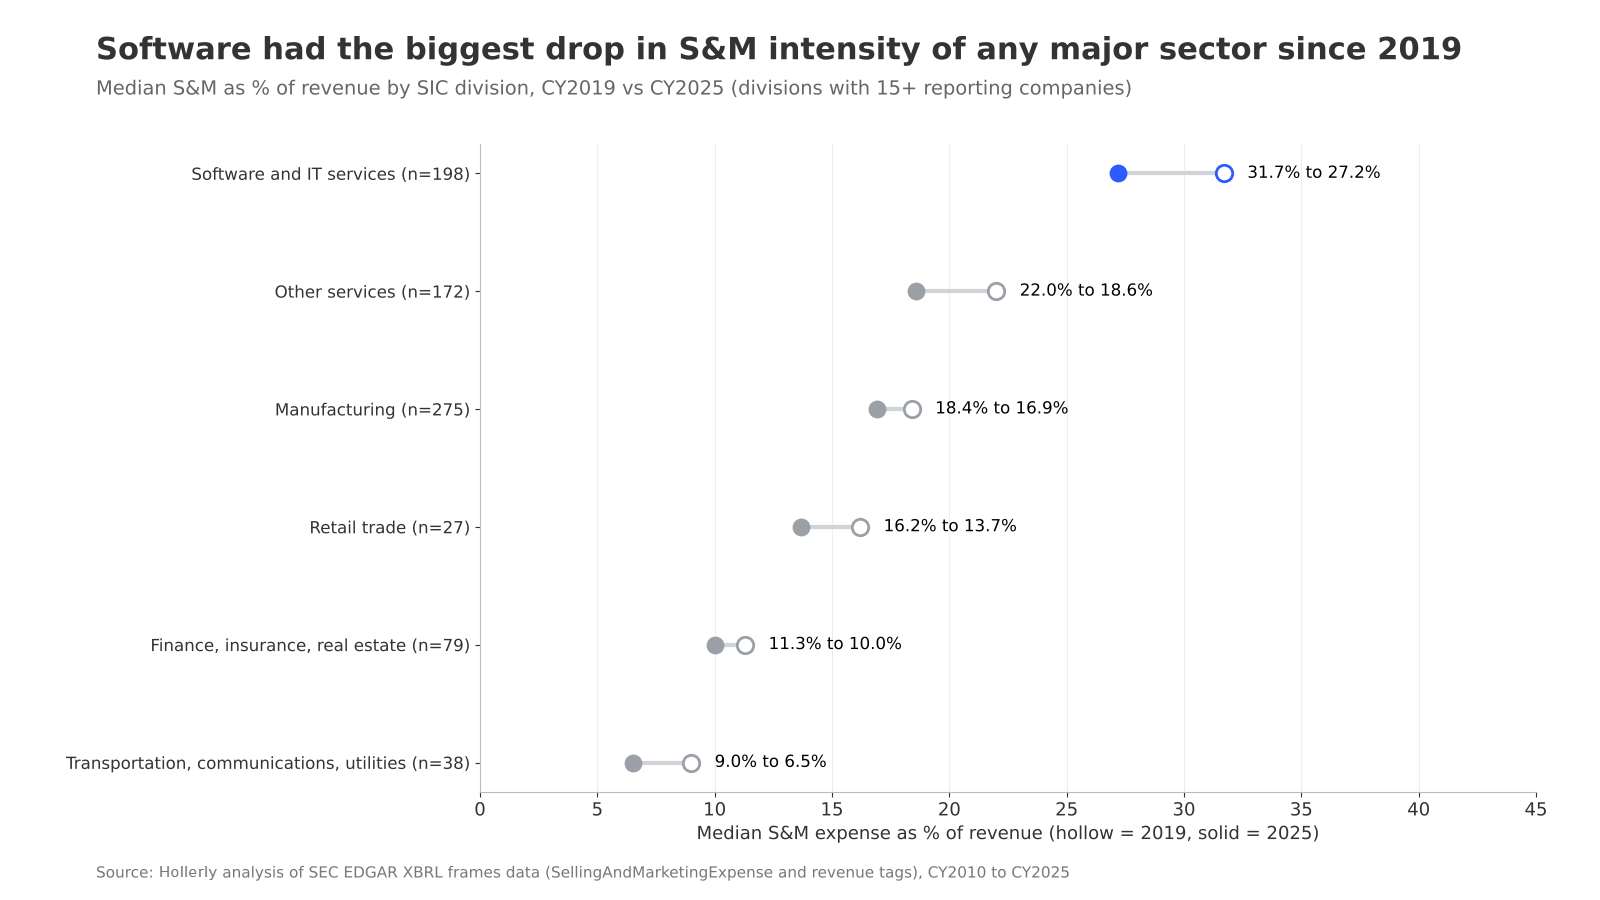
Within individual industry codes with at least 10 reporting companies in both years, computer programming and data processing (SIC 7370) had the biggest decline, from 26.6% to 19.7%. Pharmaceutical preparations (SIC 2834) moved the other way, from 31.4% to 37.7%.
What it means for sales and marketing teams
Public software companies are asking their go-to-market teams to produce revenue with a smaller share of revenue going to S&M than in any year since 2010, measured by the median. For sales and marketing leaders, that puts more weight on the cost of each meeting, lead and opportunity, and on channels and tools that let a smaller team cover more accounts.
Hollerly's plans start at $19 a month, and its pricing page compares them with free LinkedIn automation tools.
About the data
- Data: company financials reported in SEC filings (XBRL financial data), calendar years 2010 to 2025, for the US GAAP items SellingAndMarketingExpense, Revenues, RevenueFromContractWithCustomerExcludingAssessedTax and SalesRevenueNet, as available in October 2026. Industry is each filer's SIC code on record with the SEC.
- Sample: SEC filers (including foreign filers that report in US GAAP) with at least $10 million in revenue that tag SellingAndMarketingExpense. That is 12,751 company-years from 1,933 companies, including 2,438 company-years from 336 SIC 7372 (prepackaged software) companies.
- Calculation: S&M expense divided by revenue for each company and year. Revenue is the largest value reported across the three revenue tags. Figures are the median, the 25th and 75th percentiles, and an aggregate ratio (total S&M divided by total revenue). 21 company-years where S&M was more than twice revenue are excluded.
- Coverage: many companies report S&M inside selling, general and administrative expense (SG&A) and are not included. In 2025, 23.6% of all filers with $10 million or more in revenue tagged S&M separately, against 85.9% of SIC 7372 filers.
- Limitations: SIC codes are each company's current code, not its historical code. Calendar-year figures align each company's fiscal year to the nearest calendar year, so CY2025 includes some fiscal years ending in early 2026. The set of companies changes each year through IPOs, acquisitions and delistings. CY2025 reflects filings available as of October 2026.
Sources
- SEC EDGAR company filings: sec.gov/edgar/search/
- SEC SIC code list: sec.gov/search-filings/standard-industrial-classification-sic-code-list
Source: Hollerly, Sales and marketing spend at public companies, 2010 to 2025, October 2026. https://hollerlyai.com/research/sales-marketing-spend-public-companies
Charts and data are free to use under CC BY 4.0 with a link to this page. Press questions: hello@hollerlyai.com