The Median Public Software Company Now Adds $0.43 of Revenue per $1 of Sales and Marketing
Public SaaS sales efficiency over time: an SEC filings study by Hollerly. Published October 2026.
Key findings
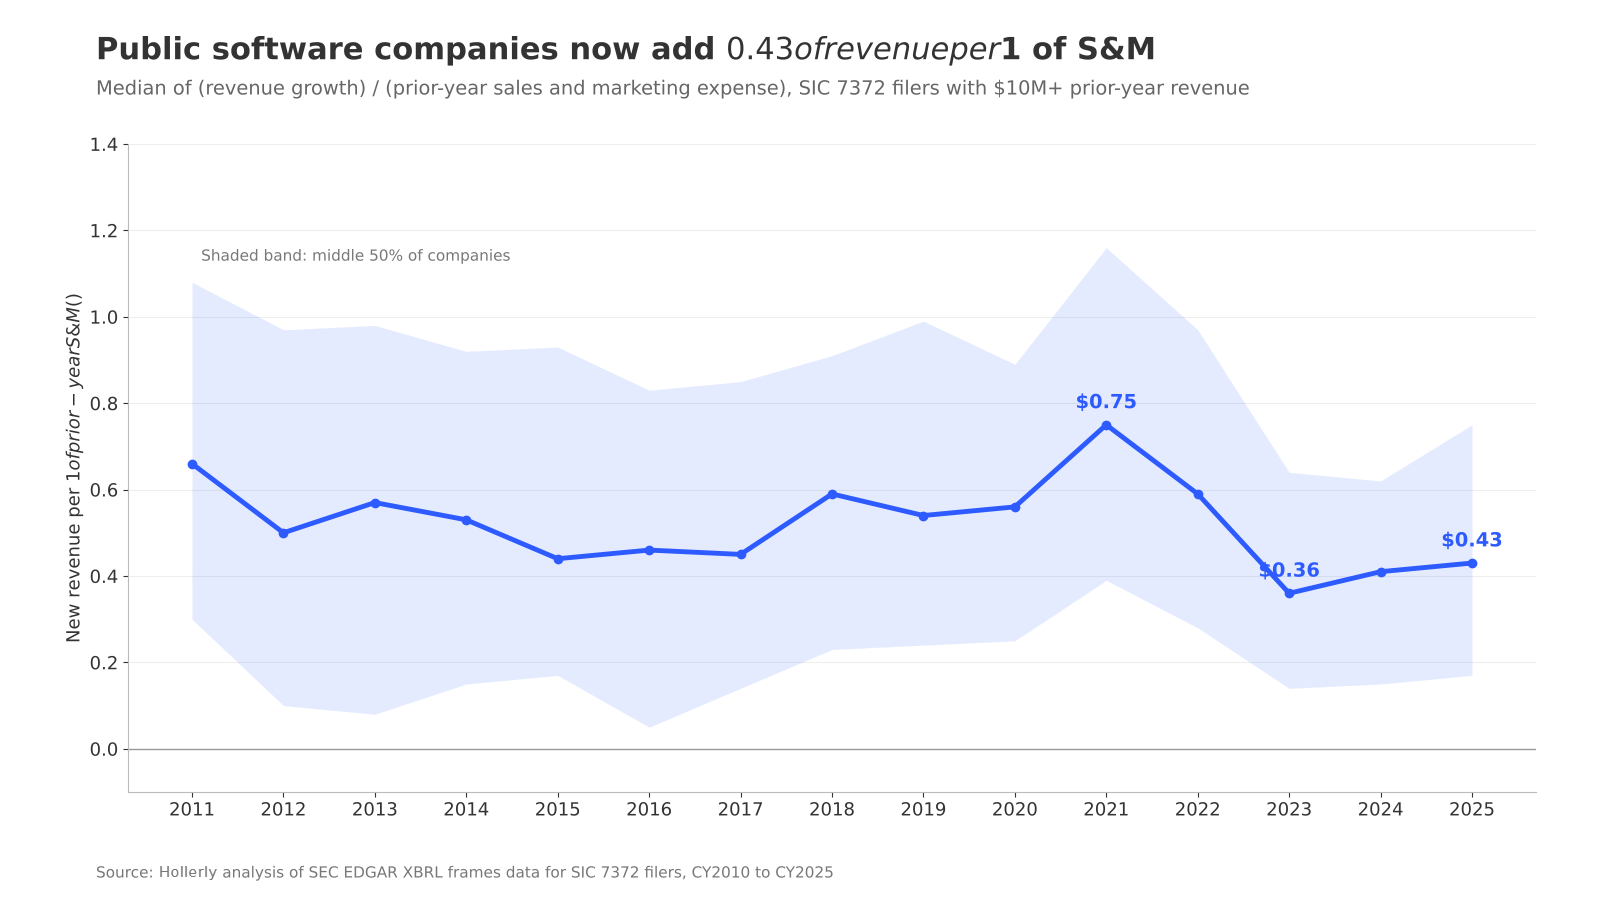
- In 2025, the median public software company filing with the SEC added $0.43 in new annual revenue for every $1 it spent on sales and marketing the year before.
- That figure peaked at $0.75 in 2021, the highest level from 2011 to 2025.
- Sales efficiency hit its low point of the period in 2023, at $0.36 of new revenue per $1 of prior-year S&M.
- The middle half of public software companies ranged from $0.17 to $0.75 of new revenue per S&M dollar in 2025.
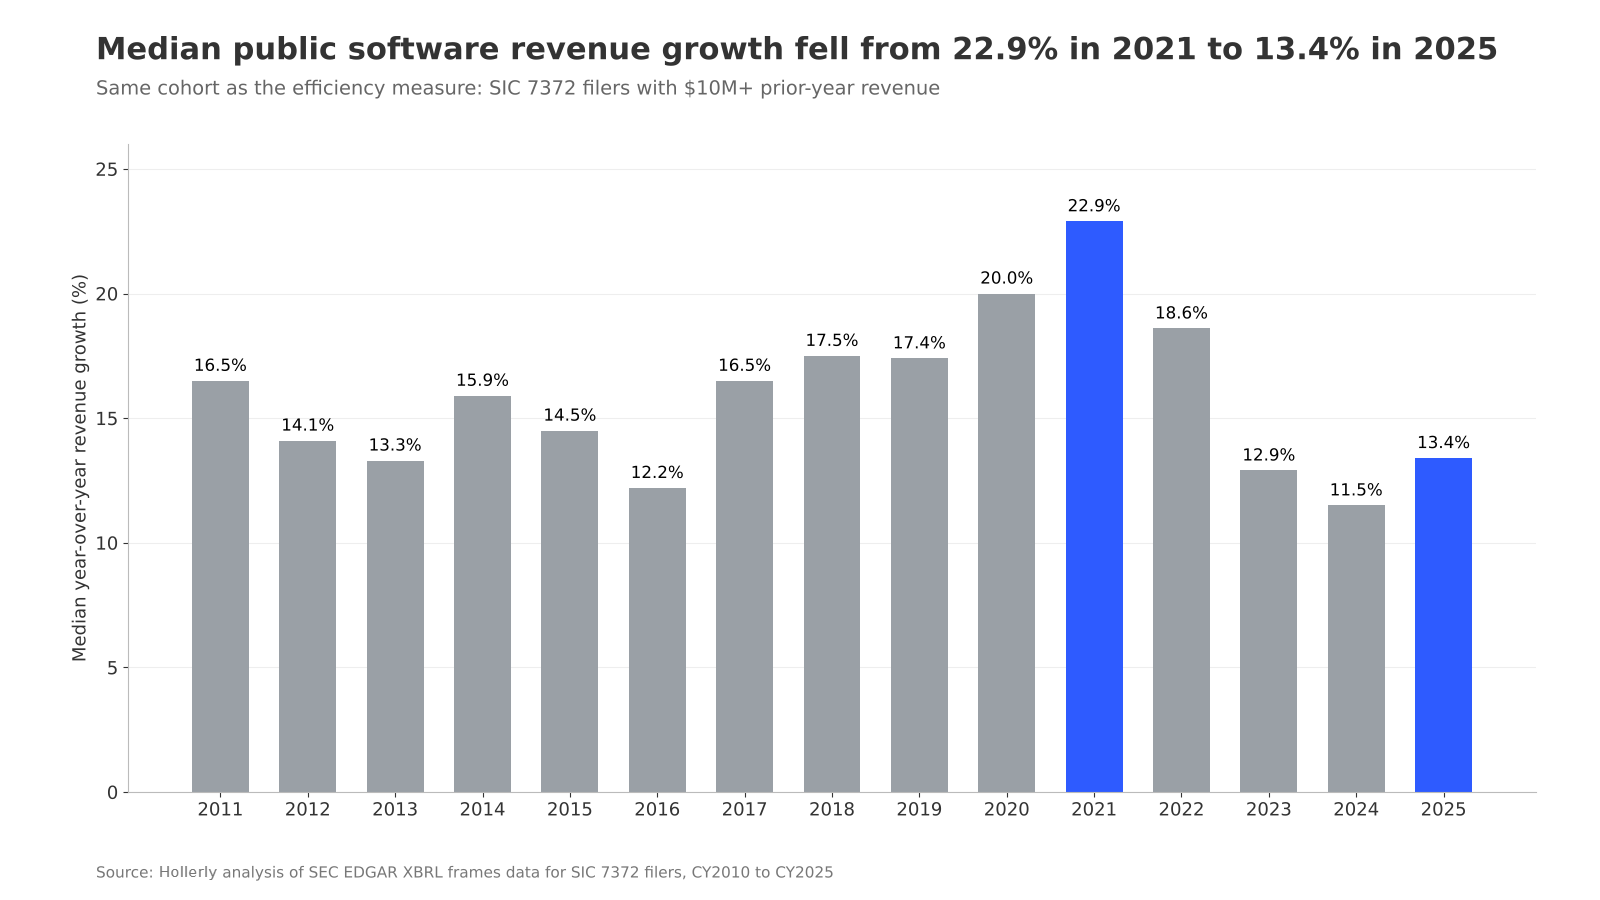
- Median revenue growth for the same companies fell from 22.9% in 2021 to 13.4% in 2025.
- 15.1% of public software companies reported lower revenue in 2025 than in 2024, up from 8.7% in 2021.
How we measured sales efficiency
Investors and CFOs often judge a SaaS go-to-market engine by how much new revenue it produces for each dollar of sales and marketing (S&M). The quarterly "magic number" used inside companies needs quarterly subscription revenue, which is not tagged consistently in SEC filings. This study uses an annual version that can be computed from the financial data every filer reports in SEC filings:
new revenue per $1 of S&M = (this year's revenue minus last year's revenue) / last year's S&M expense
It covers every SEC filer with industry code 7372 (prepackaged software) that reports S&M separately and had at least $10 million in revenue the prior year: 2,042 company-years from 320 companies between 2011 and 2025.
Efficiency peaked in 2021 and has not recovered
From 2011 through 2019, the median ranged from $0.44 to $0.66 of new revenue per dollar of prior-year S&M. It jumped to $0.75 in 2021, when demand for software surged and median revenue growth hit 22.9%.
Then it fell. The median dropped to $0.59 in 2022 and to $0.36 in 2023, the lowest of the 15 years we measured. It has since edged up to $0.41 in 2024 and $0.43 in 2025.
| Year | Companies | Median new revenue per $1 prior-year S&M | 25th percentile | 75th percentile |
|---|---|---|---|---|
| 2015 | 115 | $0.44 | $0.17 | $0.93 |
| 2019 | 129 | $0.54 | $0.24 | $0.99 |
| 2021 | 172 | $0.75 | $0.39 | $1.16 |
| 2022 | 171 | $0.59 | $0.28 | $0.97 |
| 2023 | 165 | $0.36 | $0.14 | $0.64 |
| 2024 | 159 | $0.41 | $0.15 | $0.62 |
| 2025 | 146 | $0.43 | $0.17 | $0.75 |
Growth slowed faster than spending fell
Revenue growth explains most of the change. Median year-over-year revenue growth for this group was 22.9% in 2021 and 13.4% in 2025. The share of companies with shrinking revenue rose from 8.7% in 2021 to 20.8% in 2024, before easing to 15.1% in 2025.
Over the same period, public software companies reduced S&M as a share of revenue. Our companion study found that the median fell from 34.1% in 2022 to 26.6% in 2025. Efficiency has improved slightly since 2023, but each S&M dollar still produces less new revenue than it did before 2023.
What it means for sales teams
A lower ratio means each dollar of pipeline-generation spend has to work harder. For B2B sales and marketing leaders, the 2023 to 2025 data shows public software companies growing with leaner S&M budgets, which puts more weight on how efficiently each dollar of outreach converts.
Hollerly's LinkedIn message automation tool writes each message with AI and follows up on LinkedIn and email until someone replies.
About the data
- Data: company financials reported in SEC filings (XBRL financial data), annual calendar-year values for 2010 to 2025, for the US GAAP items SellingAndMarketingExpense, Revenues, RevenueFromContractWithCustomerExcludingAssessedTax and SalesRevenueNet, as filed by October 2, 2026. Industry codes are each filer's current SIC code on EDGAR.
- Cohort: SIC 7372 filers that report SellingAndMarketingExpense, with at least $10 million in prior-year revenue and revenue reported in both years. The cohort includes foreign filers that report in US GAAP.
- Revenue: for each company and year, the largest value reported across the three revenue items, since filers use different items for total revenue.
- Calculation: (revenue in year t minus revenue in year t-1) divided by S&M in year t-1, shown as the median and the 25th and 75th percentiles by year.
- Outliers: company-years where the ratio is greater than 5 or less than -5 (68 of 2,110 company-years) are excluded. These cases usually reflect acquisitions, divestitures or reporting changes rather than organic sales performance.
- Coverage: from 2015 to 2025, between 84.8% and 87.8% of SIC 7372 filers with $10 million or more in revenue reported S&M as a separate line each year (see the Coverage tab in the companion study's data file). Companies that report S&M only within SG&A are not included.
- Limitations: this annual measure counts all revenue growth, including growth from acquisitions below the outlier threshold and from price increases. It is not the same as the quarterly magic number, which uses subscription revenue. Calendar-year values align each company's fiscal year to the nearest calendar year. 2025 includes filings available as of October 2026. The cohort changes over time as companies go public, are acquired or go private.
Sources
- SEC EDGAR company filings: sec.gov/edgar/search/
- SEC SIC code list: sec.gov/search-filings/standard-industrial-classification-sic-code-list
Source: Hollerly, Public SaaS sales efficiency (magic number) over time, October 2026. https://hollerlyai.com/research/saas-sales-efficiency
Charts and data are free to use under CC BY 4.0 with a link to this page. Press questions: hello@hollerlyai.com