Each US Manufacturing Sales Rep Supports $22.95 Million in Revenue
Revenue per sales rep by industry: a Census and BLS data study by Hollerly. Published October 2026.
Key findings
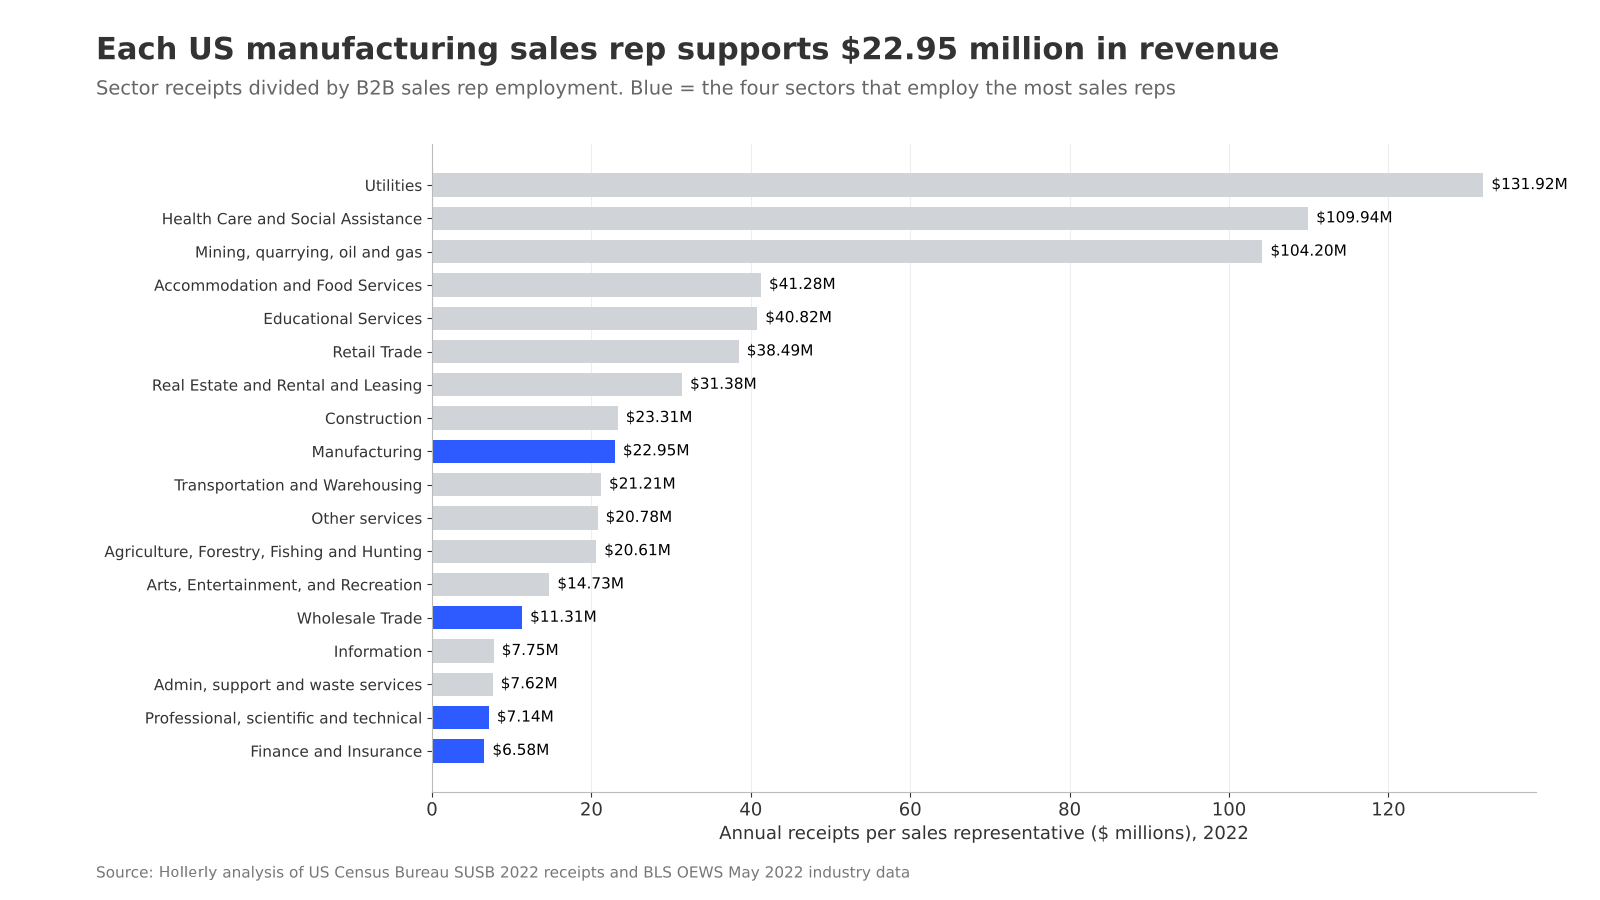
- Each sales representative in US manufacturing supported $22.95 million in industry receipts in 2022.
- Across 18 private-sector industries, US businesses generated $14.05 million in receipts for every B2B and services sales rep in 2022.
- Wholesale trade employed 1,029,270 sales reps in 2022, more than any other sector, and generated $11.31 million in receipts per rep.
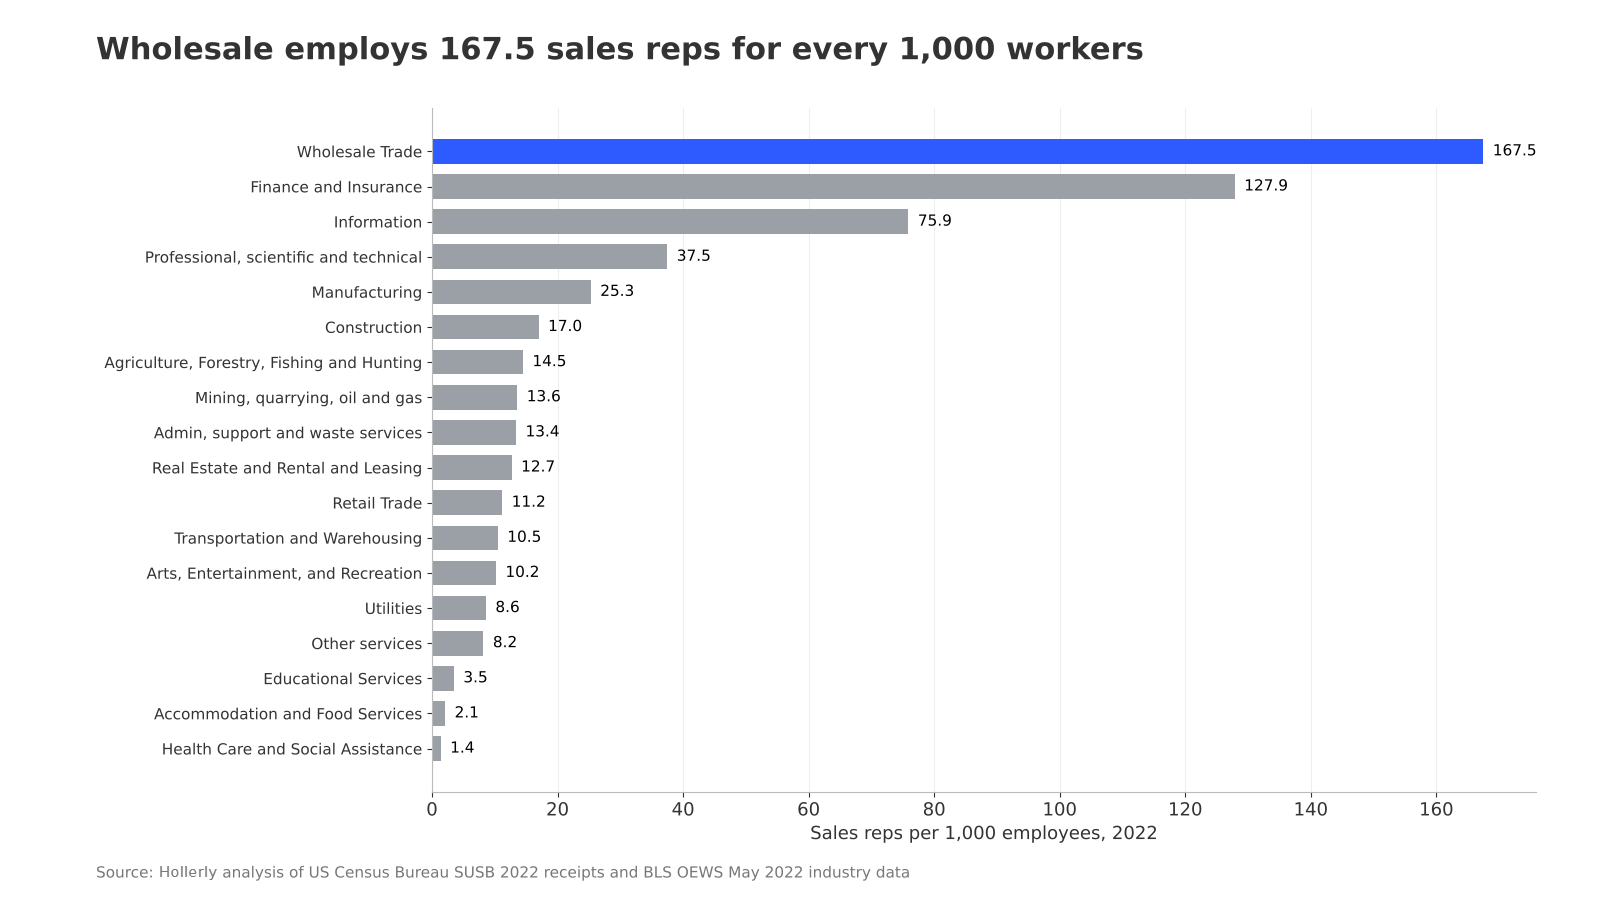
- Wholesale trade had 167.5 sales reps for every 1,000 employees, the highest concentration of any sector.
- Professional, scientific and technical services generated $7.14 million in receipts per sales rep, about a third of the manufacturing figure.
- Manufacturing generated $267 in receipts for every $1 paid to its sales reps in 2022, based on an average rep wage of $85,930.
Why this ratio matters
Sales leaders often ask how much revenue one rep should carry. Company benchmarks vary widely, so this study looks at the question from the top down: total receipts in each industry, from the Census Bureau's Statistics of US Businesses, divided by the number of sales representatives employed in that industry, from the Bureau of Labor Statistics' Occupational Employment and Wage Statistics. Both sources describe 2022.
The result is a ratio, not a quota. Not every dollar of revenue in an industry is sold by a rep. Utilities and health care, for example, earn most of their revenue without a sales team, which is why they top the chart with very few reps. The ratio is most useful in sectors where B2B sales teams are a large part of how revenue is won: wholesale, manufacturing, professional services, information and finance.
The five sectors with the largest sales forces
| Sector | Sales reps (May 2022) | Receipts per rep | Reps per 1,000 employees | Mean rep wage |
|---|---|---|---|---|
| Wholesale trade | 1,029,270 | $11.31M | 167.5 | $82,180 |
| Finance and insurance | 873,890 | $6.58M | 127.9 | $88,199 |
| Professional, scientific and technical services | 380,960 | $7.14M | 37.5 | $96,473 |
| Manufacturing | 308,210 | $22.95M | 25.3 | $85,930 |
| Information | 275,890 | $7.75M | 75.9 | $86,067 |
Manufacturing stands out. It has fewer reps per employee than wholesale, finance or information, and each rep is associated with $22.95 million in receipts. One plausible factor is the role of distributors: many manufacturers sell through wholesalers, whose own sales forces carry part of the selling work.
Services businesses run the other way. In professional, scientific and technical services, which includes agencies, consultancies and software development firms, each rep is associated with $7.14 million in receipts. Information, which includes software publishers, comes in at $7.75 million.
Where sales teams are most concentrated
Wholesale trade had 167.5 sales reps for every 1,000 employees, followed by finance and insurance at 127.9 and information at 75.9. Health care had 1.4 per 1,000 and accommodation and food services 2.1.
Comparing revenue with rep pay
Average sales rep pay differs less across industries than receipts per rep do. Mean annual wages for the reps in our definition ranged from $51,113 in arts, entertainment and recreation to $99,058 in mining. Dividing receipts by total rep pay shows how much revenue each payroll dollar in sales is associated with: $267 in manufacturing, $138 in wholesale, $90 in information and $74 in professional, scientific and technical services.
Hollerly's LinkedIn lead generation automation turns a LinkedIn search into AI-written messages and email follow-ups that stop when someone replies.
About the data
- Receipts: US Census Bureau, Statistics of US Businesses (SUSB) 2022, receipts for all employer firms by two-digit NAICS sector. SUSB publishes receipts only for years ending in 2 and 7, so 2022 is the latest year with receipts.
- Sales reps: BLS OEWS May 2022 national industry-specific estimates at the NAICS sector level, matching the SUSB year. Seven occupations are included: sales representatives, wholesale and manufacturing, technical and scientific products (41-4011); sales representatives, wholesale and manufacturing, except technical and scientific products (41-4012); sales representatives of services (41-3091); sales engineers (41-9031); advertising sales agents (41-3011); insurance sales agents (41-3021); and securities, commodities and financial services sales agents (41-3031). Retail salespersons, cashiers and sales managers are excluded. The latest OEWS release is May 2025; May 2025 rep counts are included in the data file for reference.
- Calculations: receipts per rep = sector receipts divided by sector rep employment. Reps per 1,000 employees uses SUSB March 2022 employment. Mean rep wage is the employment-weighted average of the OEWS mean annual wage for the included occupations. Receipts per dollar of rep pay = receipts divided by (rep employment times mean rep wage).
- Exclusions: management of companies (NAICS 55) and government are excluded because their receipts are not comparable. Two sector-occupation cells were suppressed by BLS (one in real estate, one in administrative and support services), so those sectors' rep counts may be slightly understated.
- Limitations: OEWS counts wage and salary workers only, so self-employed reps and independent agents are not included. Receipts include revenue not generated by sales teams. Firms are classified by industry, so a rep employed by a manufacturer may sell products made in several industries.
Sources
- US Census Bureau, SUSB 2022: www2.census.gov/programs-surveys/susb/tables/2022/us_state_6digitnaics_2022.txt
- US Bureau of Labor Statistics, OEWS May 2022 industry-specific estimates: bls.gov/oes/special-requests/oesm22in4.zip
- US Bureau of Labor Statistics, OEWS May 2025 industry-specific estimates: bls.gov/oes/special-requests/oesm25in4.zip
- BLS OEWS tables: bls.gov/oes/tables.htm
Source: Hollerly, Revenue per sales rep by industry, October 2026. https://hollerlyai.com/research/revenue-per-sales-rep-by-industry
Charts and data are free to use under CC BY 4.0 with a link to this page. Press questions: hello@hollerlyai.com