Sales Managers Are the Fastest-Growing Sales Job in the US Through 2035
Fastest-growing sales jobs through 2035. Published October 2026.
Hollerly analysis of BLS Employment Projections, 2025-35
Key findings
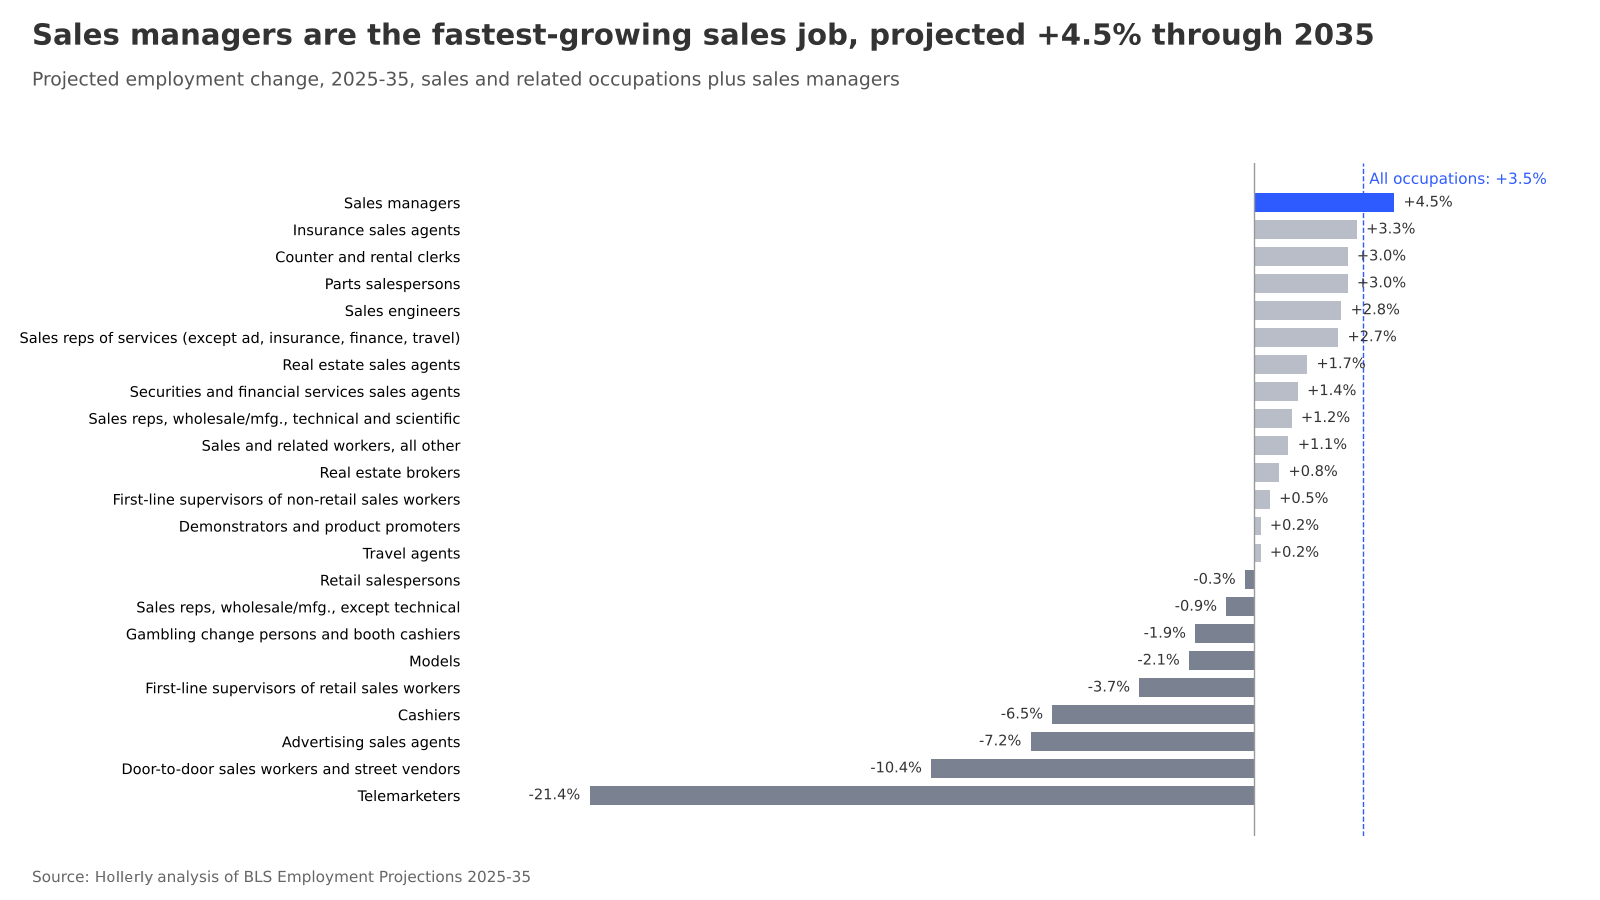
- Sales managers are the fastest-growing sales occupation, projected to grow 4.5% from 2025 to 2035, above the 3.5% projected for all occupations.
- Within the sales and related occupational group, insurance sales agents grow fastest, at 3.3%.
- Telemarketers are projected to shrink the most, by 21.4% (13,000 jobs).
- Sales and related occupations as a whole are projected to decline 1.4% by 2035, from 14,533,200 to 14,326,400 jobs.
- Cashiers will generate the most openings of any sales job, about 521,300 a year.
- The seven B2B-focused sales roles studied will have 319,700 openings a year combined through 2035.
- 14 of 23 sales occupations are projected to grow and 9 to decline.
Sales management grows, the overall sales workforce shrinks
The Bureau of Labor Statistics projects total US employment to grow 3.5% between 2025 and 2035. Sales and related occupations, the largest group of sales jobs, are projected to move the other way, falling 1.4%. Cashiers alone account for 200,600 of the 206,800-job net decline.
Sales managers sit at the top of the list at +4.5%, adding 29,000 jobs. Within the sales and related group itself, insurance sales agents lead at +3.3%.
B2B sales roles hold steady
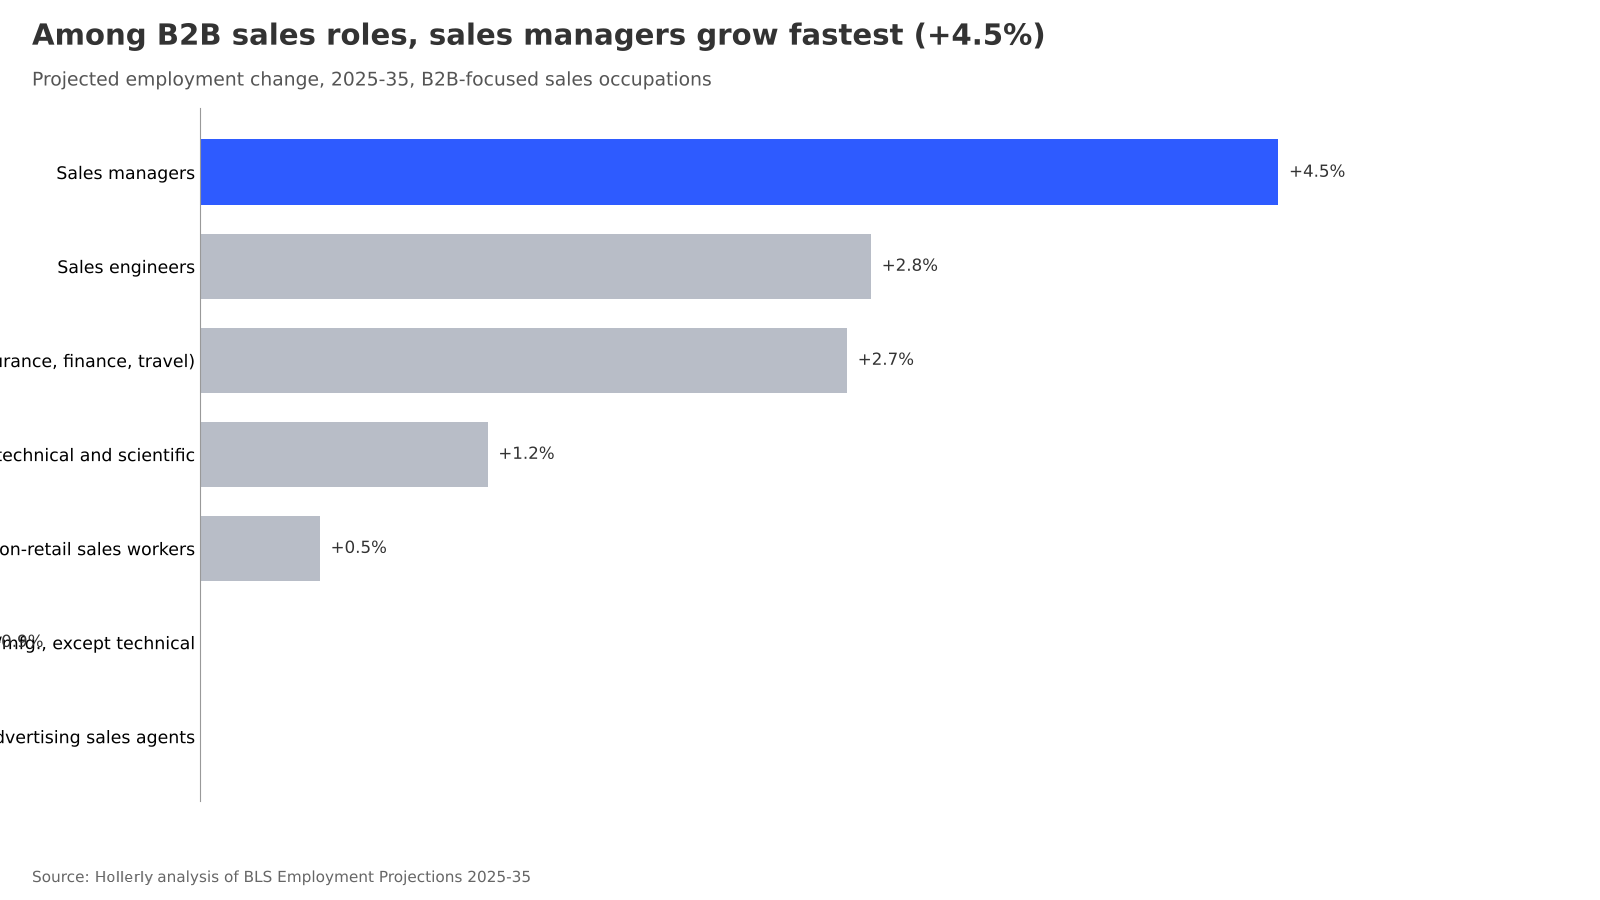
The occupations that cover most business-to-business selling show modest, mostly positive projections:
| Occupation | Change 2025-35 | Openings per year | Median wage 2025 |
|---|---|---|---|
| Sales managers | +4.5% | 47,300 | $148,270 |
| Sales engineers | +2.8% | 3,800 | $124,900 |
| Sales representatives of services, except advertising, insurance, financial services, and travel | +2.7% | 115,700 | $69,990 |
| Sales representatives, wholesale and manufacturing, technical and scientific products | +1.2% | 23,600 | $104,920 |
| First-line supervisors of non-retail sales workers | +0.5% | 21,700 | $87,520 |
| Sales representatives, wholesale and manufacturing, except technical and scientific products | -0.9% | 99,800 | $72,080 |
| Advertising sales agents | -7.2% | 7,800 | $64,820 |
Growth is only part of the hiring picture. BLS openings also count replacement demand from workers who retire or change careers. Even with slow growth, these seven roles are projected to produce 319,700 openings a year.
Where the openings are
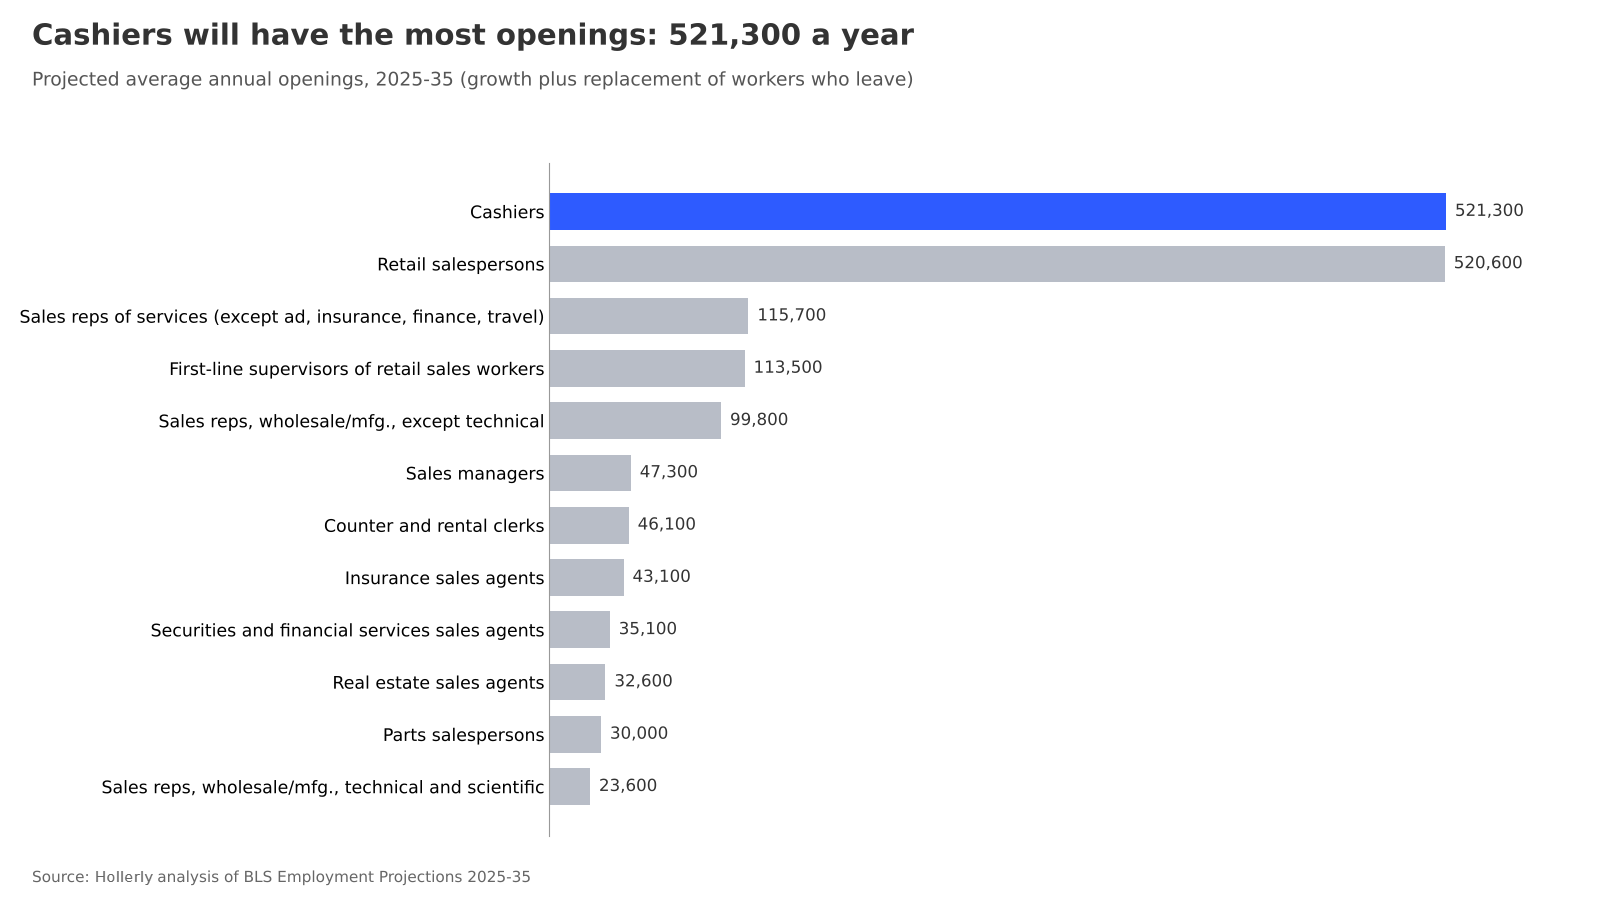
Cashiers and retail salespersons dominate the openings count because they are large occupations with high turnover. Among roles more typical of B2B sales, sales representatives of services, except advertising, insurance, financial services, and travel lead with 115,700 openings a year.
Full table
| Occupation | SOC | Jobs 2025 | Jobs 2035 | Change | Openings per year | Median wage 2025 |
|---|---|---|---|---|---|---|
| Sales managers | 11-2022 | 650,100 | 679,100 | +4.5% | 47,300 | $148,270 |
| Insurance sales agents | 41-3021 | 572,600 | 591,400 | +3.3% | 43,100 | $62,280 |
| Counter and rental clerks | 41-2021 | 409,400 | 421,900 | +3.0% | 46,100 | $41,300 |
| Parts salespersons | 41-2022 | 273,300 | 281,600 | +3.0% | 30,000 | $38,630 |
| Sales engineers | 41-9031 | 51,600 | 53,000 | +2.8% | 3,800 | $124,900 |
| Sales representatives of services, except advertising, insurance, financial services, and travel | 41-3091 | 1,272,700 | 1,306,700 | +2.7% | 115,700 | $69,990 |
| Real estate sales agents | 41-9022 | 427,000 | 434,500 | +1.7% | 32,600 | $52,830 |
| Securities, commodities, and financial services sales agents | 41-3031 | 531,000 | 538,500 | +1.4% | 35,100 | $78,660 |
| Sales representatives, wholesale and manufacturing, technical and scientific products | 41-4011 | 292,000 | 295,500 | +1.2% | 23,600 | $104,920 |
| Sales and related workers, all other | 41-9099 | 115,300 | 116,600 | +1.1% | 13,100 | $48,280 |
| Real estate brokers | 41-9021 | 103,500 | 104,300 | +0.8% | 7,800 | $73,220 |
| First-line supervisors of non-retail sales workers | 41-1012 | 311,900 | 313,600 | +0.5% | 21,700 | $87,520 |
| Demonstrators and product promoters | 41-9011 | 70,400 | 70,500 | +0.2% | 11,400 | $39,320 |
| Travel agents | 41-3041 | 61,500 | 61,700 | +0.2% | 5,900 | $50,160 |
| Retail salespersons | 41-2031 | 3,998,100 | 3,984,100 | -0.3% | 520,600 | $35,410 |
| Sales representatives, wholesale and manufacturing, except technical and scientific products | 41-4012 | 1,279,400 | 1,268,200 | -0.9% | 99,800 | $72,080 |
| Gambling change persons and booth cashiers | 41-2012 | 22,000 | 21,600 | -1.9% | 3,900 | $36,220 |
| Models | 41-9012 | 4,200 | 4,100 | -2.1% | 700 | $48,470 |
| First-line supervisors of retail sales workers | 41-1011 | 1,419,800 | 1,367,400 | -3.7% | 113,500 | $48,520 |
| Cashiers | 41-2011 | 3,106,300 | 2,905,700 | -6.5% | 521,300 | $32,880 |
| Advertising sales agents | 41-3011 | 99,300 | 92,200 | -7.2% | 7,800 | $64,820 |
| Door-to-door sales workers, news and street vendors, and related workers | 41-9091 | 50,900 | 45,600 | -10.4% | 4,800 | $41,380 |
| Telemarketers | 41-9041 | 60,900 | 47,800 | -21.4% | 5,800 | $35,450 |
To reach these buyers directly, Hollerly's LinkedIn prospecting software finds the right people on LinkedIn and writes each first message with AI.
About the data
- Source: U.S. Bureau of Labor Statistics, Employment Projections program, 2025-35 projections (Table 1.2), the latest release as of October 2026. Employment figures are published in thousands and shown here as whole numbers.
- Sample: all 23 detailed occupations in SOC major group 41 (sales and related) plus SOC 11-2022, sales managers. The "B2B-focused" subset is sales managers (11-2022), first-line supervisors of non-retail sales workers (41-1012), advertising sales agents (41-3011), services sales reps (41-3091), wholesale and manufacturing reps (41-4011 and 41-4012) and sales engineers (41-9031).
- Measures: projected percent and numeric employment change 2025-35, average annual occupational openings 2025-35, and 2025 median annual wage (from OEWS, as published in the projections table).
- Limitations: projections are revised every year and reflect BLS assumptions about the economy; they are not forecasts of any single company's hiring. Projections include self-employed workers, while wages cover wage and salary workers only.
Sources
- BLS Employment Projections, occupation.xlsx: bls.gov/emp/ind-occ-matrix/occupation.xlsx
- BLS Employment Projections tables: bls.gov/emp/tables.htm
Source: Hollerly, Fastest-growing sales jobs through 2035, October 2026. https://hollerlyai.com/research/fastest-growing-sales-jobs-2035
Charts and data are free to use under CC BY 4.0 with a link to this page. Press questions: hello@hollerlyai.com