Wages and salaries, which include commissions, make up 75.3% of sales workers' compensation vs 70.0% for all private-sector workers
How Sales Pay Is Built: Wages, Bonuses and Benefits. Published October 2026.
Hollerly analysis of the BLS Employer Costs for Employee Compensation series, March 2010 to June 2026
Key findings
- In June 2026, wages and salaries (the BLS category that includes commissions) made up 75.3% of employer compensation costs for private-industry sales and related workers, compared with 70.0% for all private-industry workers.
- Supplemental pay (overtime, shift differentials and nonproduction bonuses) accounted for 2.9% of sales workers' compensation in June 2026, below the 4.0% average for private-industry workers.
- Employers spent $1.05 per hour worked on supplemental pay for sales workers in June 2026, up 106% from $0.51 in March 2010.
- Total employer compensation for sales and related workers averaged $35.85 per hour worked in June 2026, compared with $46.89 for all private-industry workers.
- Benefits made up 24.7% of sales workers' total compensation in June 2026, compared with 30.0% across private industry.
- Hourly compensation costs for sales workers rose 74% between March 2010 and June 2026, compared with 69% for all private-industry workers.
Commissions sit inside wages, not bonuses
A common assumption is that sales pay is heavy on bonuses. The federal data shows a different structure. The Bureau of Labor Statistics counts commissions and other incentive pay tied to sales or output as part of wages and salaries. Its "supplemental pay" category is narrower: overtime and premium pay, shift differentials, and nonproduction bonuses, meaning bonuses not tied to an individual's own output, such as holiday or year-end bonuses.
Under that definition, sales and related occupations put more of their compensation into the wage line and less into supplemental pay than the average private-sector job. In June 2026, wages and salaries were 75.3% of sales workers' total compensation, compared with 70.0% for all private-industry workers. Supplemental pay was 2.9% for sales workers and 4.0% overall.
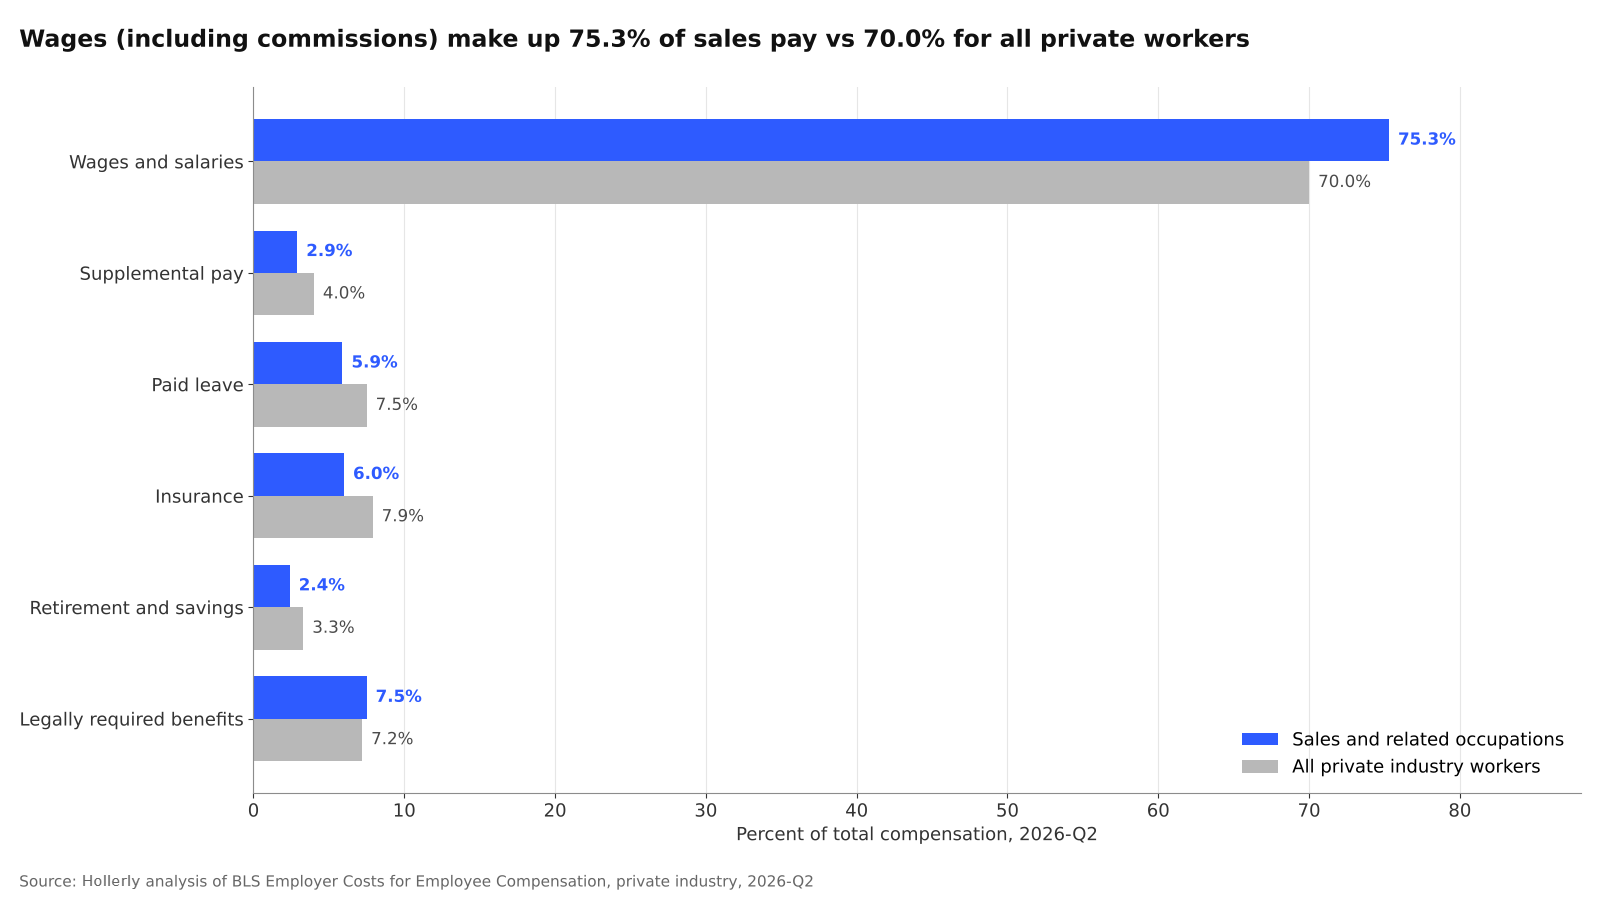
The full mix, June 2026
| Component | Sales and related (% of comp) | All private industry (% of comp) | Sales ($/hr worked) | All private ($/hr worked) |
|---|---|---|---|---|
| Wages and salaries | 75.3% | 70.0% | $26.99 | $32.82 |
| Supplemental pay | 2.9% | 4.0% | $1.05 | $1.88 |
| Paid leave | 5.9% | 7.5% | $2.11 | $3.54 |
| Insurance | 6.0% | 7.9% | $2.16 | $3.69 |
| Retirement and savings | 2.4% | 3.3% | $0.85 | $1.57 |
| Legally required benefits | 7.5% | 7.2% | $2.69 | $3.40 |
Benefit costs that scale with hours or headcount, such as paid leave, insurance and retirement contributions, all take a smaller share of sales compensation than the private-industry average. Legally required benefits (Social Security, Medicare, unemployment insurance and workers' compensation) are the one category where the sales share is slightly higher, at 7.5% vs 7.2%. Those payroll taxes are levied on wages, including commissions, so they track the wage-heavy pay structure.
Supplemental pay over time
Since 2010, supplemental pay for sales and related workers has stayed in a narrow band, between 2.1% and 3.0% of total compensation in every quarter. The private-industry average moved up over the same period, from 2.9% in March 2010 to 4.0% in June 2026, so the gap between the two has widened.
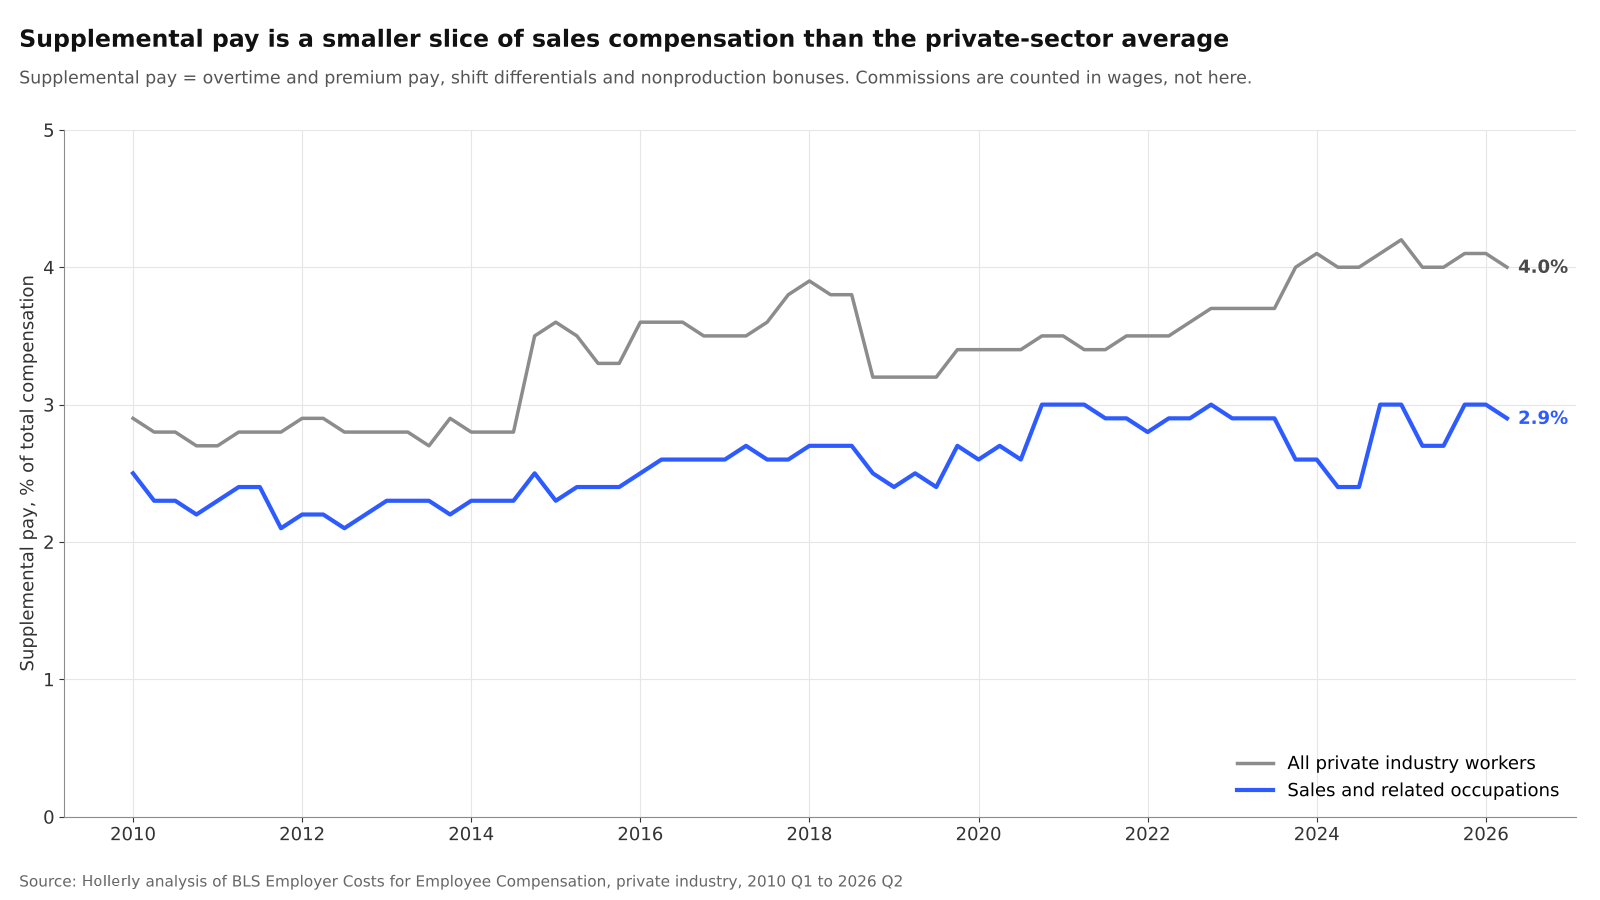
In dollar terms, supplemental pay for sales workers still grew. Employers spent $1.05 per hour worked on it in June 2026, compared with $0.51 in March 2010.
What this means for sales leaders and RevOps teams
Total employer cost for a sales and related worker averaged $35.85 per hour worked in June 2026, or about 76% of the $46.89 private-industry average. That gap reflects the occupation mix: the BLS group includes large numbers of retail cashiers and counter clerks alongside B2B account executives and sales engineers. The structure, though, is consistent: a sales comp dollar is more likely to be paid as wages (base plus commission) and less likely to go to benefits or discretionary bonuses.
For teams building comp plans or benchmarking cost per rep, the practical point is that federal "bonus" figures understate variable pay in sales. Commission plans show up in the wage line.
Hollerly's plans start at $19 a month, and its pricing page compares them with free LinkedIn automation tools.
About the data
- Source: U.S. Bureau of Labor Statistics, Employer Costs for Employee Compensation (ECEC), part of the National Compensation Survey. Latest quarter June 2026 (2026 Q2).
- Sample: Private industry workers, all establishment sizes, "Sales and related occupations" major group vs "All occupations." The BLS sales group covers retail and wholesale sales workers, sales representatives, real estate and insurance agents, and similar roles. It does not break out B2B sales separately.
- Measures: Percent of total compensation and employer cost per hour worked for wages and salaries, supplemental pay, paid leave, insurance, retirement and savings, and legally required benefits. Quarterly, 2010 Q1 to 2026 Q2. Values are as published; percent changes are computed from the published dollar figures.
- Definitions: BLS includes commissions, production bonuses and other incentive pay in wages and salaries. Supplemental pay includes overtime and premium pay, shift differentials and nonproduction bonuses. ECEC cannot isolate commission pay as a separate component.
- Limitations: ECEC measures employer cost per hour worked, not employee earnings. Quarterly estimates for a single occupational group carry sampling error and can move with sample rotation. The "other benefits" category is not published for sales occupations, so sales components sum to 100% only with rounding. Dollar figures are not adjusted for inflation.
Sources
- BLS ECEC time series (cm.data.1.AllData): download.bls.gov/pub/time.series/cm/cm.data.1.AllData
- BLS ECEC series definitions: download.bls.gov/pub/time.series/cm/cm.series
- BLS ECEC news release, June 2026: bls.gov/news.release/ecec.nr0.htm
- BLS ECEC technical note: bls.gov/news.release/ecec.tn.htm
- BLS National Compensation Survey glossary: bls.gov/ncs/ncs-glossary.htm
Source: Hollerly, How Sales Pay Is Built: Wages, Bonuses and Benefits, October 2026. https://hollerlyai.com/research/sales-supplemental-pay
Charts and data are free to use under CC BY 4.0 with a link to this page. Press questions: hello@hollerlyai.com