B2B Sales Reps in Computer and Electronic Product Manufacturing Earn the Most, Averaging $112,999 a Year
Sales rep pay by industry. Published October 2026.
Hollerly analysis of BLS Occupational Employment and Wage Statistics, May 2025
Key findings
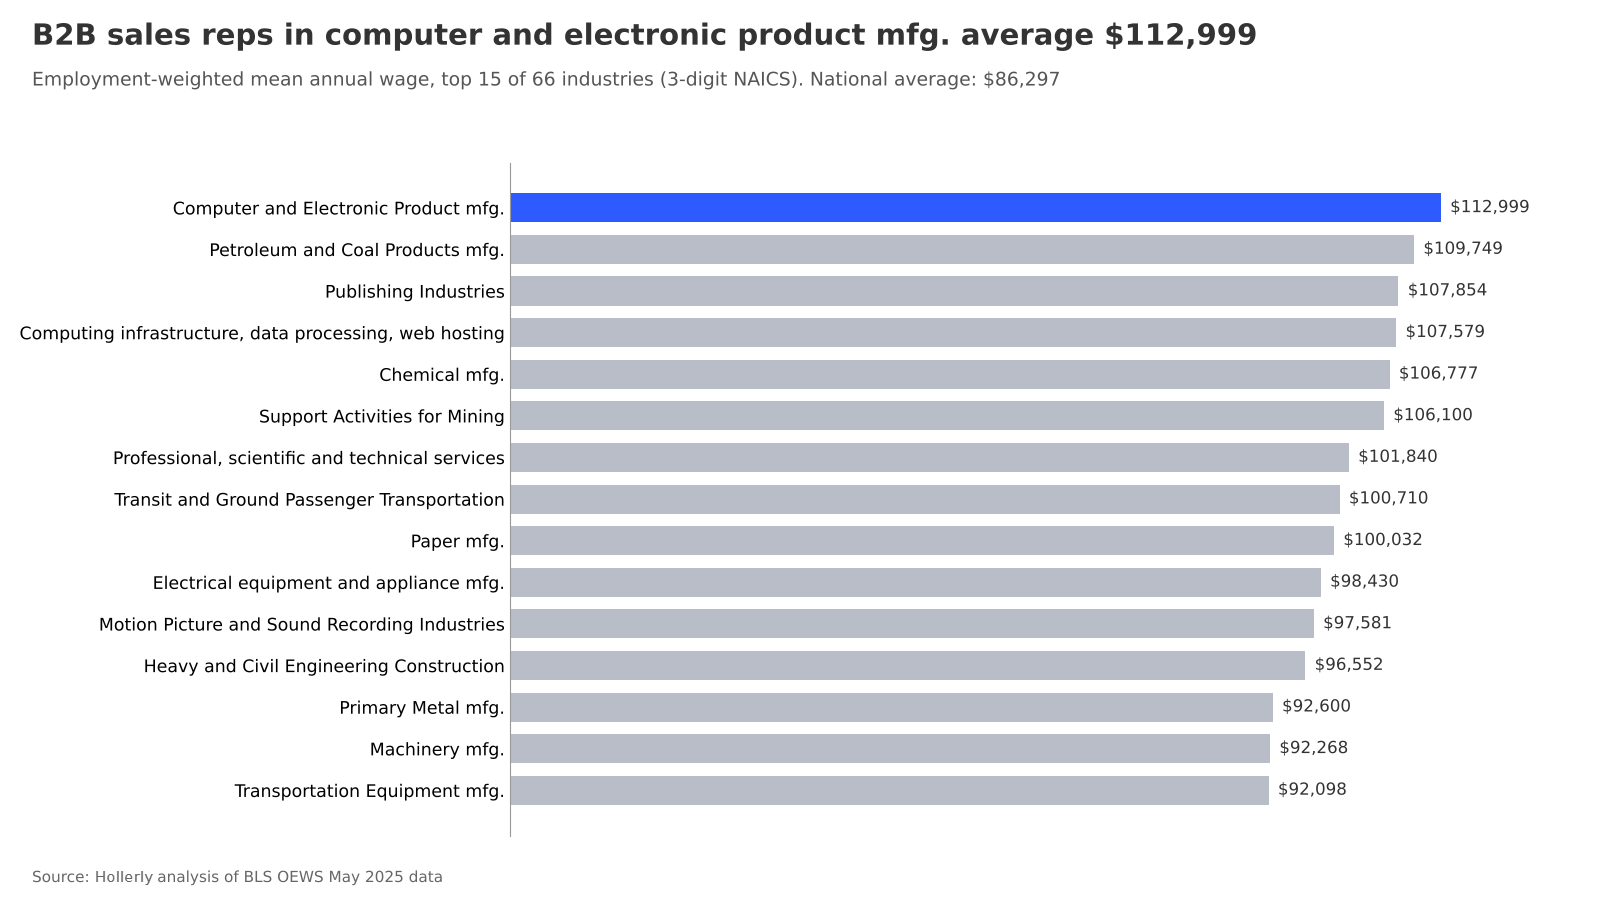
- B2B sales reps in computer and electronic product manufacturing average $112,999 a year, the highest of 66 industries in the BLS OEWS May 2025 data.
- B2B sales reps in general merchandise retailers average $54,302, the lowest of the 66 industries ranked.
- The gap between the highest- and lowest-paying industries for B2B sales reps is $58,697 a year (2.1x).
- 9 of 66 industries pay B2B sales reps an average of $100,000 or more.
- Across all industries, the 2,779,000 B2B sales reps in the three occupations studied average $86,297 a year.
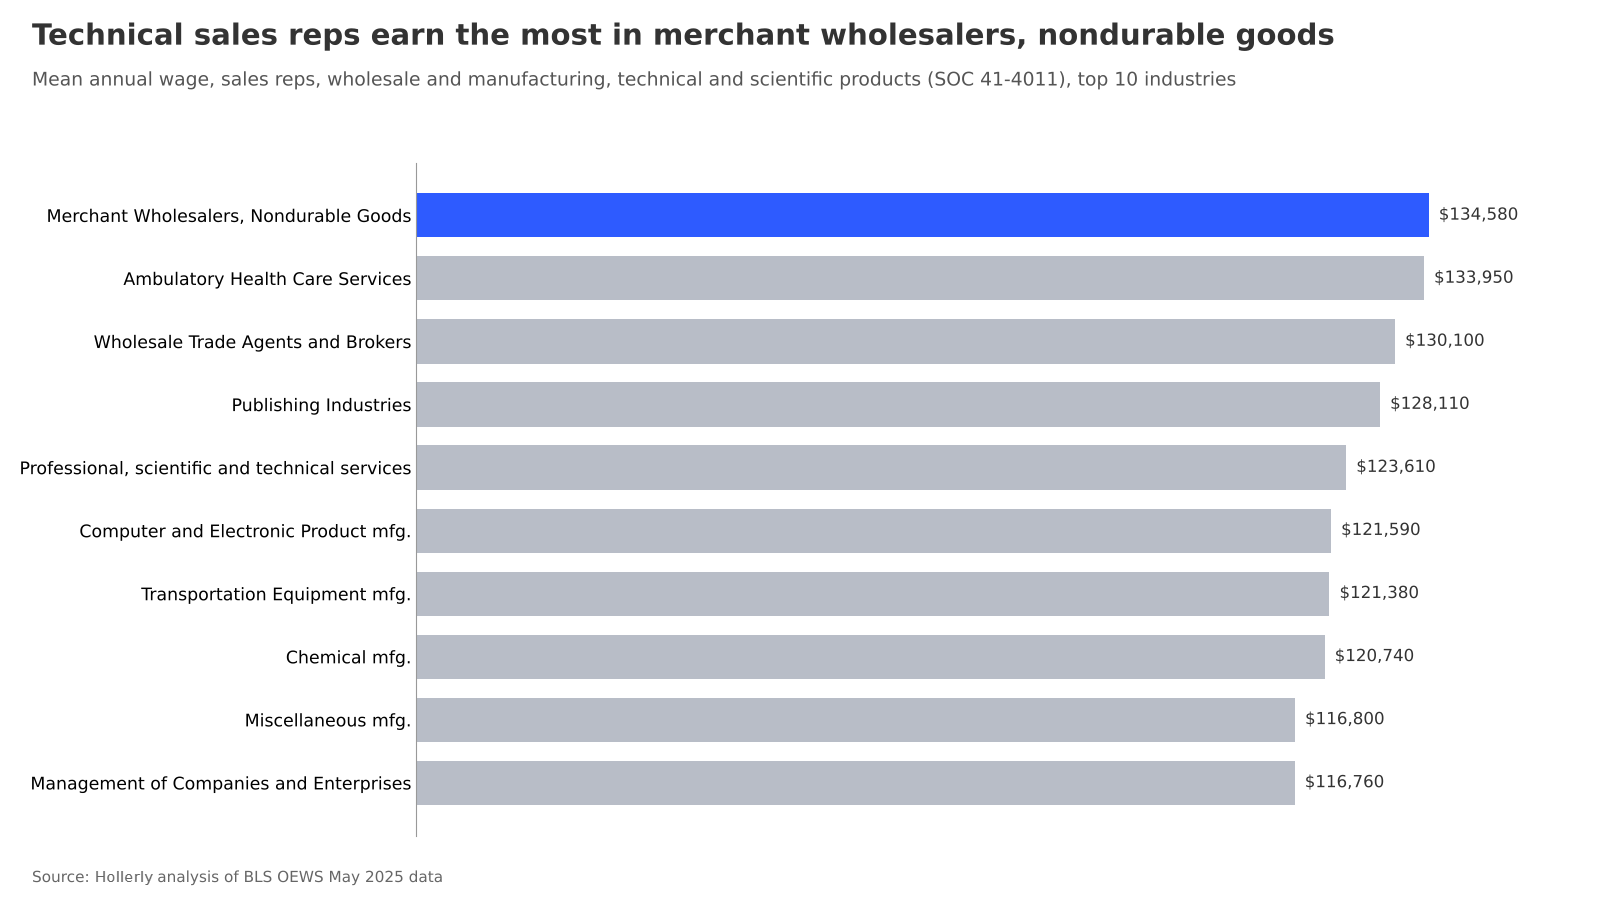
- Technical and scientific product sales reps earn the most in merchant wholesalers, nondurable goods, averaging $134,580.
- Merchant Wholesalers, Durable Goods employs the most B2B sales reps (551,750), with an average wage of $88,474.
Where B2B sales reps earn the most
Pay for B2B sales reps depends heavily on what they sell. We ranked 66 industries by the average annual wage of the three occupations that cover most business-to-business selling: technical and scientific product reps, other wholesale and manufacturing reps, and services sales reps.
Computer and Electronic Product Manufacturing sits at the top at $112,999, followed by Petroleum and Coal Products Manufacturing ($109,749) and Publishing Industries ($107,854). The national average across all industries for the same three occupations is $86,297.
| Rank | Industry | B2B rep employment | Mean annual wage |
|---|---|---|---|
| 1 | Computer and Electronic Product Manufacturing | 29,830 | $112,999 |
| 2 | Petroleum and Coal Products Manufacturing | 2,170 | $109,749 |
| 3 | Publishing Industries | 76,560 | $107,854 |
| 4 | Computing Infrastructure Providers, Data Processing, Web Hosting, and Related Services | 38,300 | $107,579 |
| 5 | Chemical Manufacturing | 21,590 | $106,777 |
| 6 | Support Activities for Mining | 4,650 | $106,100 |
| 7 | Professional, Scientific, and Technical Services | 349,300 | $101,840 |
| 8 | Transit and Ground Passenger Transportation | 4,350 | $100,710 |
| 9 | Paper Manufacturing | 7,830 | $100,032 |
| 10 | Electrical Equipment, Appliance, and Component Manufacturing | 11,110 | $98,430 |
Most of the top 10 sell complex or technical products: electronics, petroleum and chemicals, publishing (the NAICS group that includes software publishers), data infrastructure and hosting, and mining support. Professional, scientific and technical services, which employs 349,300 B2B reps, also clears the $100,000 mark.
Where pay is lowest
At the other end, reps in general merchandise retailers average $54,302. Retailers, personal services, accommodation and the performing arts fill most of the bottom 10.
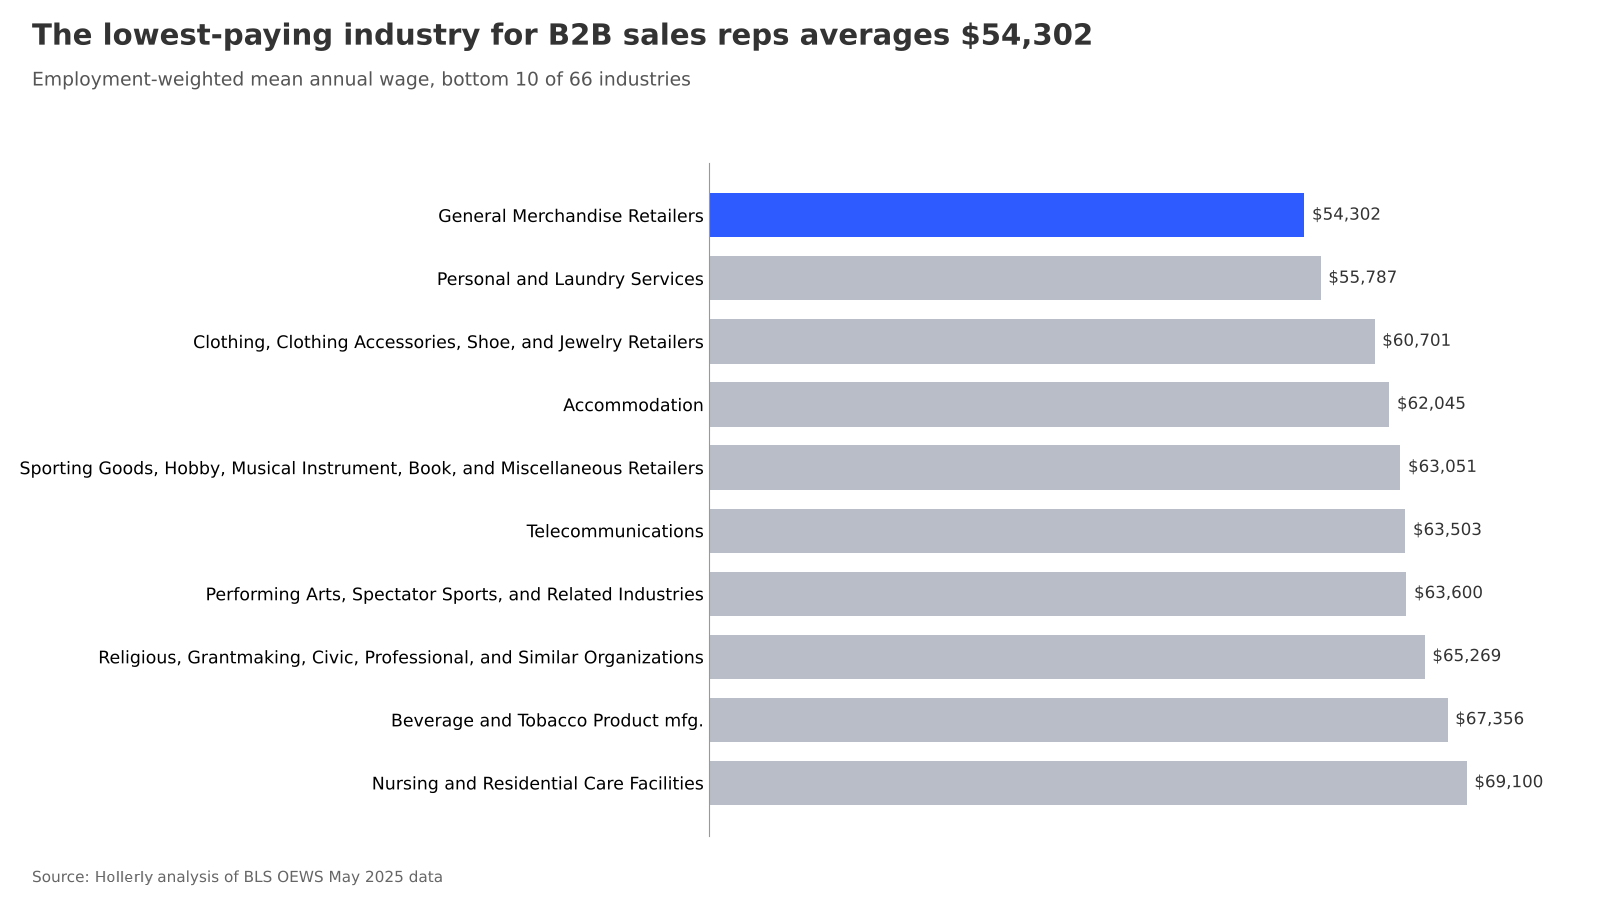
The spread from top to bottom is $58,697 a year. For a rep weighing two offers with similar quotas, industry alone can shift expected pay by tens of thousands of dollars.
Where most B2B reps actually work
The best-paying industries are not the biggest employers. Wholesale trade and professional services account for the largest pools of B2B sales reps:
| Industry | B2B rep employment | Mean annual wage |
|---|---|---|
| Merchant Wholesalers, Durable Goods | 551,750 | $88,474 |
| Professional, Scientific, and Technical Services | 349,300 | $101,840 |
| Merchant Wholesalers, Nondurable Goods | 330,570 | $88,918 |
| Administrative and Support Services | 170,540 | $74,097 |
| Specialty Trade Contractors | 110,490 | $82,764 |
Technical reps: the pay leaders
Looking only at technical and scientific product reps (SOC 41-4011), the highest-paying industry with at least 1,000 such reps (and a mean wage RSE of 20% or less) is merchant wholesalers, nondurable goods, at $134,580 a year.
National pay by occupation
| SOC | Occupation | Employment | Mean wage | Median wage |
|---|---|---|---|---|
| 41-3091 | Sales Representatives of Services, Except Advertising, Insurance, Financial Services, and Travel | 1,256,010 | $82,430 | $69,990 |
| 41-4011 | Sales Representatives, Wholesale and Manufacturing, Technical and Scientific Products | 284,800 | $119,730 | $104,920 |
| 41-4012 | Sales Representatives, Wholesale and Manufacturing, Except Technical and Scientific Products | 1,238,190 | $82,530 | $72,080 |
Hollerly's plans start at $19 a month, and its pricing page compares them with free LinkedIn automation tools.
About the data
- Source: U.S. Bureau of Labor Statistics, Occupational Employment and Wage Statistics (OEWS), May 2025 estimates, the latest release available as of 2026-10-02. National industry-specific estimates at the 3-digit NAICS level (85 industries), plus national cross-industry estimates.
- Occupations: SOC 41-4011 (sales representatives, wholesale and manufacturing, technical and scientific products), SOC 41-4012 (sales representatives, wholesale and manufacturing, except technical and scientific products) and SOC 41-3091 (sales representatives of services, except advertising, insurance, financial services, and travel). We call these "B2B sales reps" for readability.
- Calculation: For each industry, the combined mean wage is the employment-weighted average of the published mean annual wages for whichever of the three occupations BLS reports in that industry. Medians cannot be combined this way, so occupation-level medians are listed separately in data.xlsx.
- Sample: 66 industries had all reported cells released, a relative standard error of 20% or less on every mean wage used, and at least 1,000 combined B2B sales rep jobs. 17 industries were excluded because an employment or wage estimate was suppressed by BLS, a mean wage had a relative standard error above 20%, or the industry had fewer than 1,000 reps (listed in the "Excluded industries" tab).
- Limitations: OEWS wages include base pay, commissions and production bonuses but exclude overtime premiums, non-production bonuses, stock and benefits. OEWS covers wage and salary workers and excludes the self-employed. Industry mixes differ: an industry with more technical reps will tend to rank higher. Wages above the OEWS top-code are not published and are treated as missing.
Sources
- BLS OEWS May 2025, national industry-specific estimates: bls.gov/oes/special-requests/oesm25in4.zip
- BLS OEWS May 2025, national estimates: bls.gov/oes/special-requests/oesm25nat.zip
- OEWS data tables index: bls.gov/oes/tables.htm
Source: Hollerly, Sales rep pay by industry, October 2026. https://hollerlyai.com/research/sales-rep-pay-by-industry
Charts and data are free to use under CC BY 4.0 with a link to this page. Press questions: hello@hollerlyai.com