Median pay for seven professional sales roles rose 12% to 21% from 2020 to 2025, behind the 25.4% rise in consumer prices
Sales Rep Pay vs Inflation Since 2015. Published October 2026.
Hollerly analysis of BLS OEWS wage data (May 2015 to May 2025) and the Consumer Price Index
Key findings
- Between May 2020 and May 2025, median annual pay rose 12.1% to 21.1% across seven sales occupations, while the CPI-U rose 25.4%.
- Median pay for sales managers rose 12.1% in nominal terms from May 2020 to May 2025, from $132,290 to $148,270, but fell 10.6% after adjusting for inflation.
- Wholesale and manufacturing sales reps for technical and scientific products saw the smallest real decline of the tracked roles since 2020, at 3.4%.
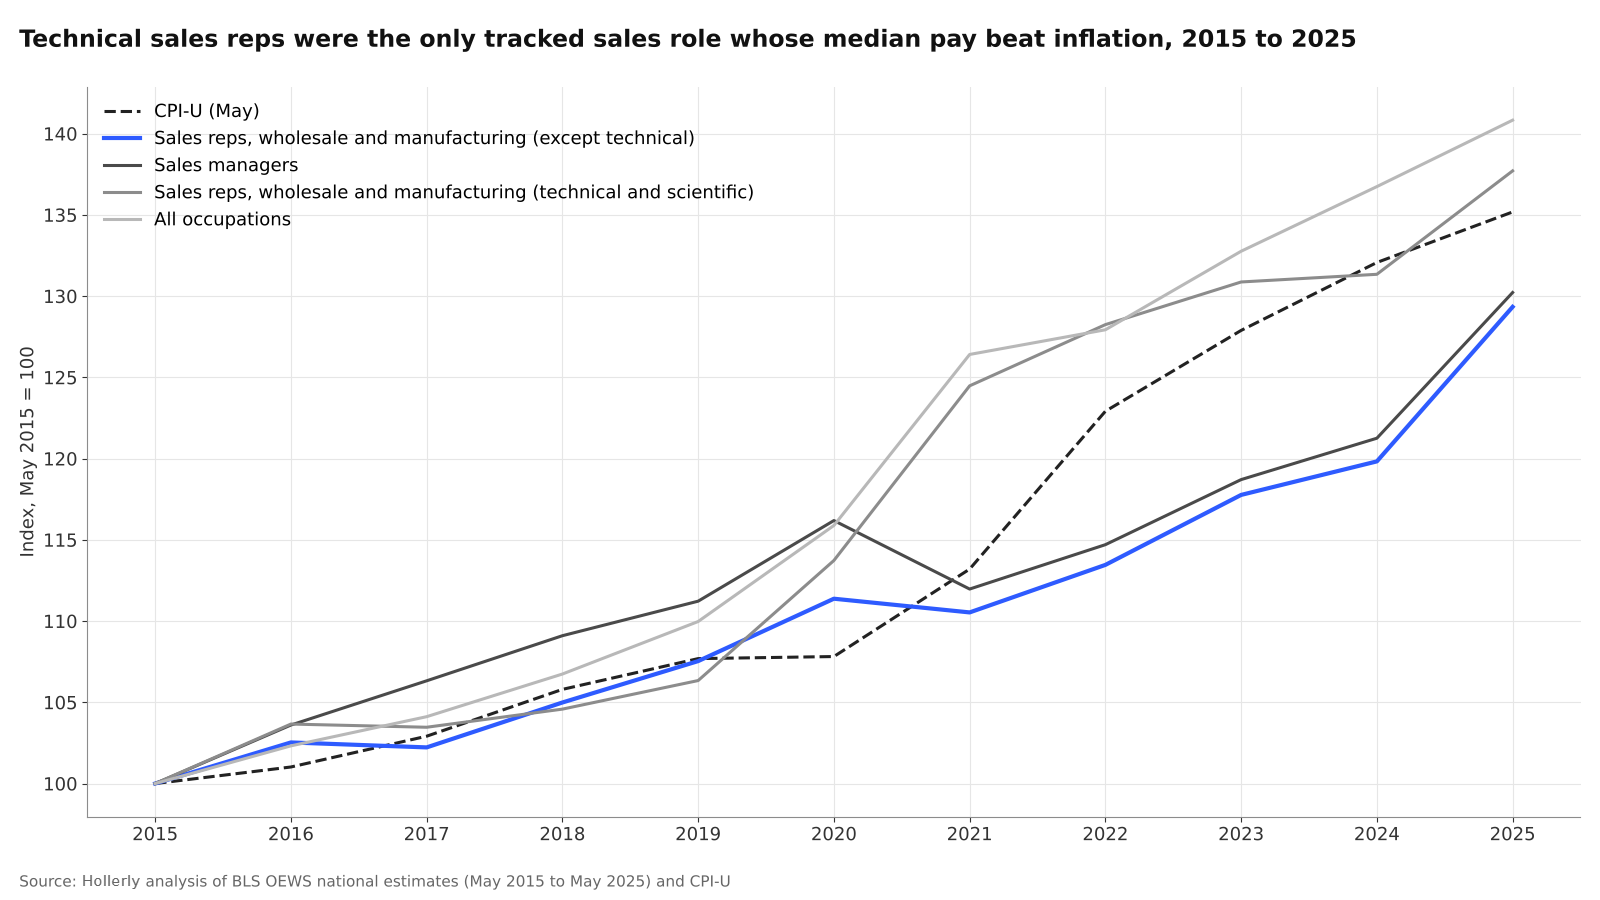
- Over the longer May 2015 to May 2025 window, technical and scientific sales reps were the only tracked sales role whose median pay outpaced inflation, with a real gain of 1.9%.
- The median wage across all US occupations rose 4.2% in real terms from 2015 to 2025, while median pay for sales managers fell 3.7%.
- The median sales engineer earned $124,900 in May 2025, up 27.9% from $97,650 in May 2015, against 35.2% cumulative inflation.
Nominal raises, real declines
Paychecks for sales professionals grew in dollar terms over the past five years. The median sales manager made $148,270 in May 2025, compared with $132,290 in May 2020. The median wholesale and manufacturing sales rep for non-technical products went from $62,070 to $72,080.
Consumer prices rose faster. The CPI-U increased 25.4% between May 2020 and May 2025, and every one of the seven sales occupations tracked here had a smaller increase in median pay. The real (inflation-adjusted) changes ranged from -3.4% to -10.6%.
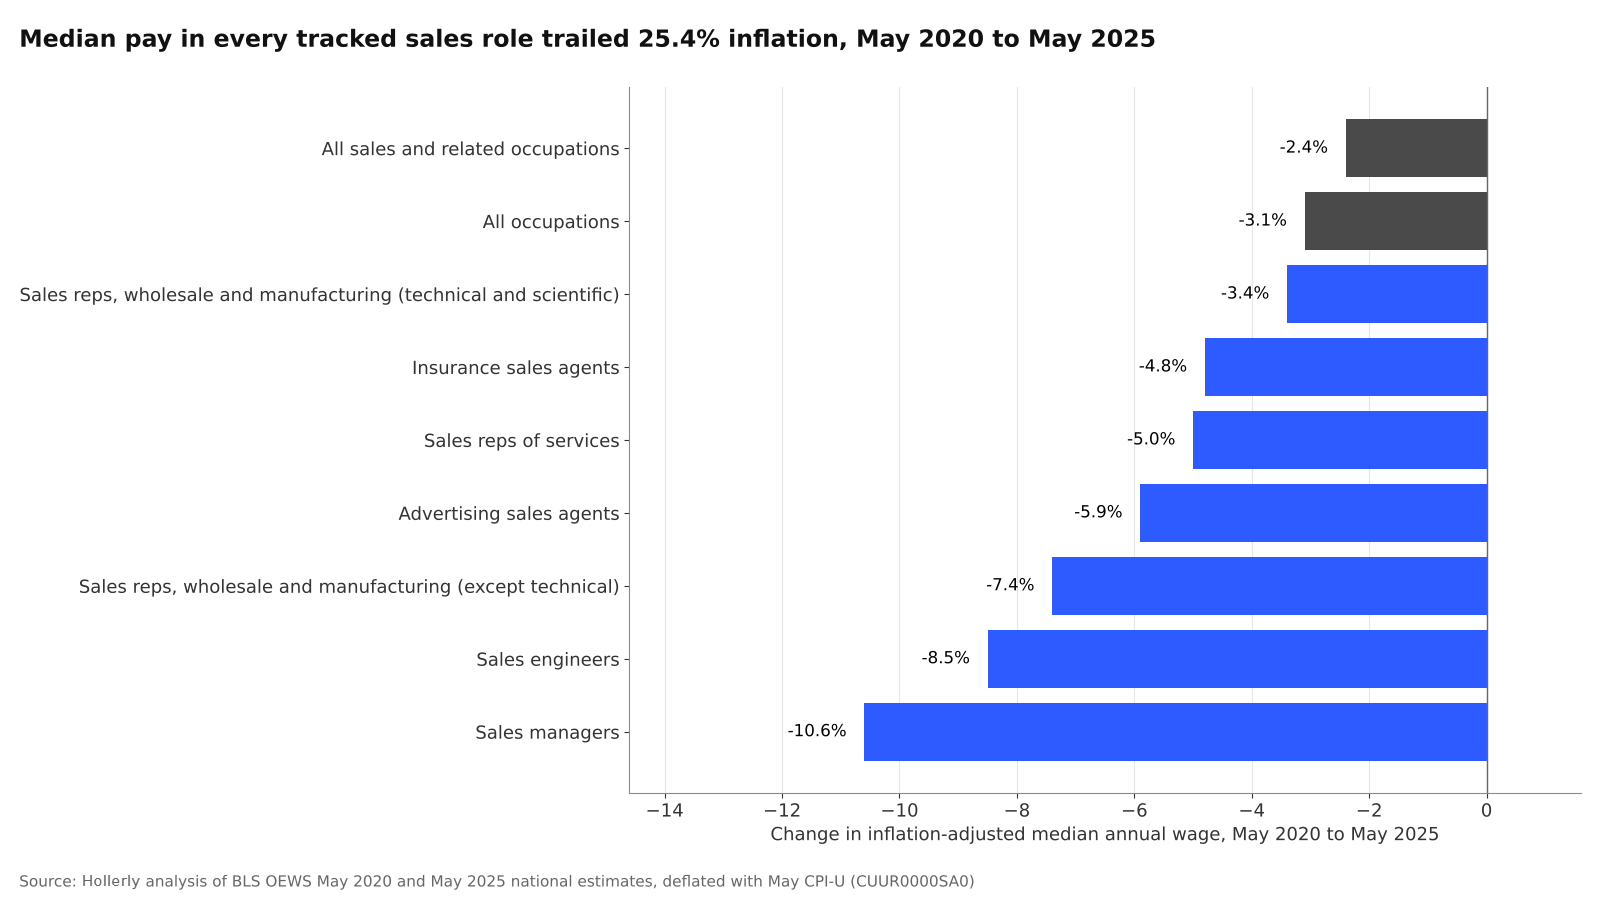
The 2020 starting point needs care. May 2020 OEWS estimates were collected during the early pandemic, and consumer prices were nearly flat that spring (the May CPI-U was up 0.1% from May 2019). Both factors make the 2020 to 2025 comparison less favorable to wages than a longer window would be.
The 10-year view
Starting from May 2015 smooths out the pandemic period. Consumer prices rose 35.2% between May 2015 and May 2025. Median pay for technical and scientific sales reps rose 37.7% over the same span, a real gain of 1.9%. The other five occupations tracked over the full decade had real declines between 1.1% and 5.4%.
| Occupation | Median 2015 | Median 2020 | Median 2025 | Nominal 2020 to 2025 | Real 2020 to 2025 | Real 2015 to 2025 |
|---|---|---|---|---|---|---|
| Sales managers | $113,860 | $132,290 | $148,270 | +12.1% | -10.6% | -3.7% |
| Sales engineers | $97,650 | $108,830 | $124,900 | +14.8% | -8.5% | -5.4% |
| Sales reps, wholesale and manufacturing (technical and scientific) | $76,190 | $86,650 | $104,920 | +21.1% | -3.4% | +1.9% |
| Sales reps, wholesale and manufacturing (except technical) | $55,730 | $62,070 | $72,080 | +16.1% | -7.4% | -4.3% |
| Insurance sales agents | $48,200 | $52,180 | $62,280 | +19.4% | -4.8% | -4.4% |
| Advertising sales agents | $48,490 | $54,940 | $64,820 | +18.0% | -5.9% | -1.1% |
| Sales reps of services | n/a | $58,770 | $69,990 | +19.1% | -5.0% | n/a |
| All sales and related occupations | $25,660 | $31,500 | $38,530 | +22.3% | -2.4% | +11.1% |
| All occupations | $36,200 | $41,950 | $50,980 | +21.5% | -3.1% | +4.2% |
The all-occupation and all-sales medians did better in real terms over the decade (+4.2% and +11.1%). Those groups are weighted toward hourly and retail jobs, whose pay followed a different path from the professional sales roles above.
One caveat for comp planners: OEWS measures base wages plus commissions and production bonuses, but excludes nonproduction bonuses and the value of benefits or equity. Total compensation for sales roles with large year-end bonuses can move differently.
Hollerly's plans start at $19 a month, and its pricing page compares them with free LinkedIn automation tools.
About the data
- Wage data: U.S. Bureau of Labor Statistics, Occupational Employment and Wage Statistics (OEWS), national cross-industry estimates, May 2015 through May 2025. May 2025 is the latest release. Median annual wage is the primary measure.
- Inflation: CPI-U, U.S. city average, all items, not seasonally adjusted (series CUUR0000SA0), May value of each year, to match the OEWS May reference period.
- Occupations (SOC): Sales Managers (11-2022), Sales Engineers (41-9031), Sales Representatives, Wholesale and Manufacturing, Technical and Scientific Products (41-4011), Sales Representatives, Wholesale and Manufacturing, Except Technical and Scientific Products (41-4012), Insurance Sales Agents (41-3021), Advertising Sales Agents (41-3011) and Sales Representatives of Services (41-3091, 2020 to 2025 only because of the 2018 SOC code change).
- Calculation: Real change = (wage in 2025 / CPI May 2025) divided by (wage in base year / CPI May base year), minus one.
- Limitations: OEWS pools three years of survey panels and ages older wage data with the Employment Cost Index, so BLS cautions against reading small year-to-year changes. OEWS wages include commissions but exclude nonproduction bonuses, stock and benefits. Medians describe the middle of each occupation and can shift with changes in the mix of jobs.
Sources
- BLS OEWS national estimates, May 2025: bls.gov/oes/special-requests/oesm25nat.zip
- BLS OEWS national estimates, May 2020: bls.gov/oes/special-requests/oesm20nat.zip
- BLS OEWS national estimates, May 2015: bls.gov/oes/special-requests/oesm15nat.zip
- BLS Consumer Price Index (CPI-U, CUUR0000SA0): bls.gov/cpi/
- BLS OEWS technical notes and FAQ: bls.gov/oes/oes_ques.htm
Source: Hollerly, Sales Rep Pay vs Inflation Since 2015, October 2026. https://hollerlyai.com/research/sales-pay-vs-inflation
Charts and data are free to use under CC BY 4.0 with a link to this page. Press questions: hello@hollerlyai.com