There Is One Sales Manager for Every 6.1 Sales Reps in the US; Specialty Trade Contractors Run Leanest
Sales manager-to-rep ratio by industry. Published October 2026.
Hollerly analysis of BLS Occupational Employment and Wage Statistics, May 2025
Key findings
- Across all US industries there are 6.1 sales reps for every sales manager (3,894,480 reps and 637,080 sales managers).
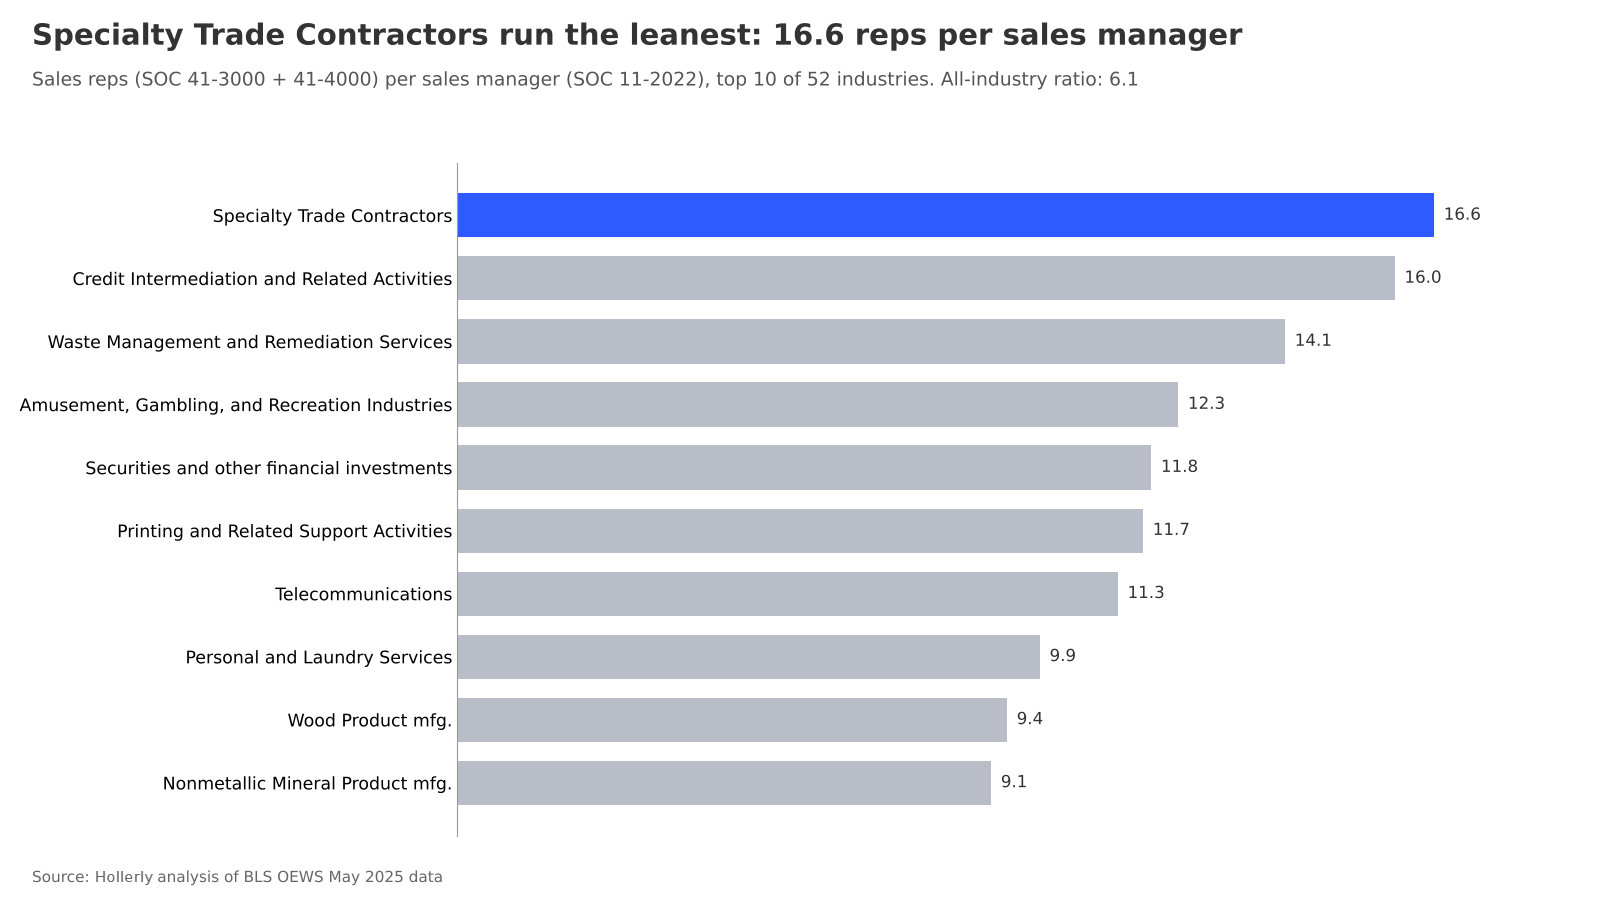
- Specialty Trade Contractors run the leanest sales teams, with 16.6 reps per sales manager.
- The median industry has 5.6 sales reps per sales manager.
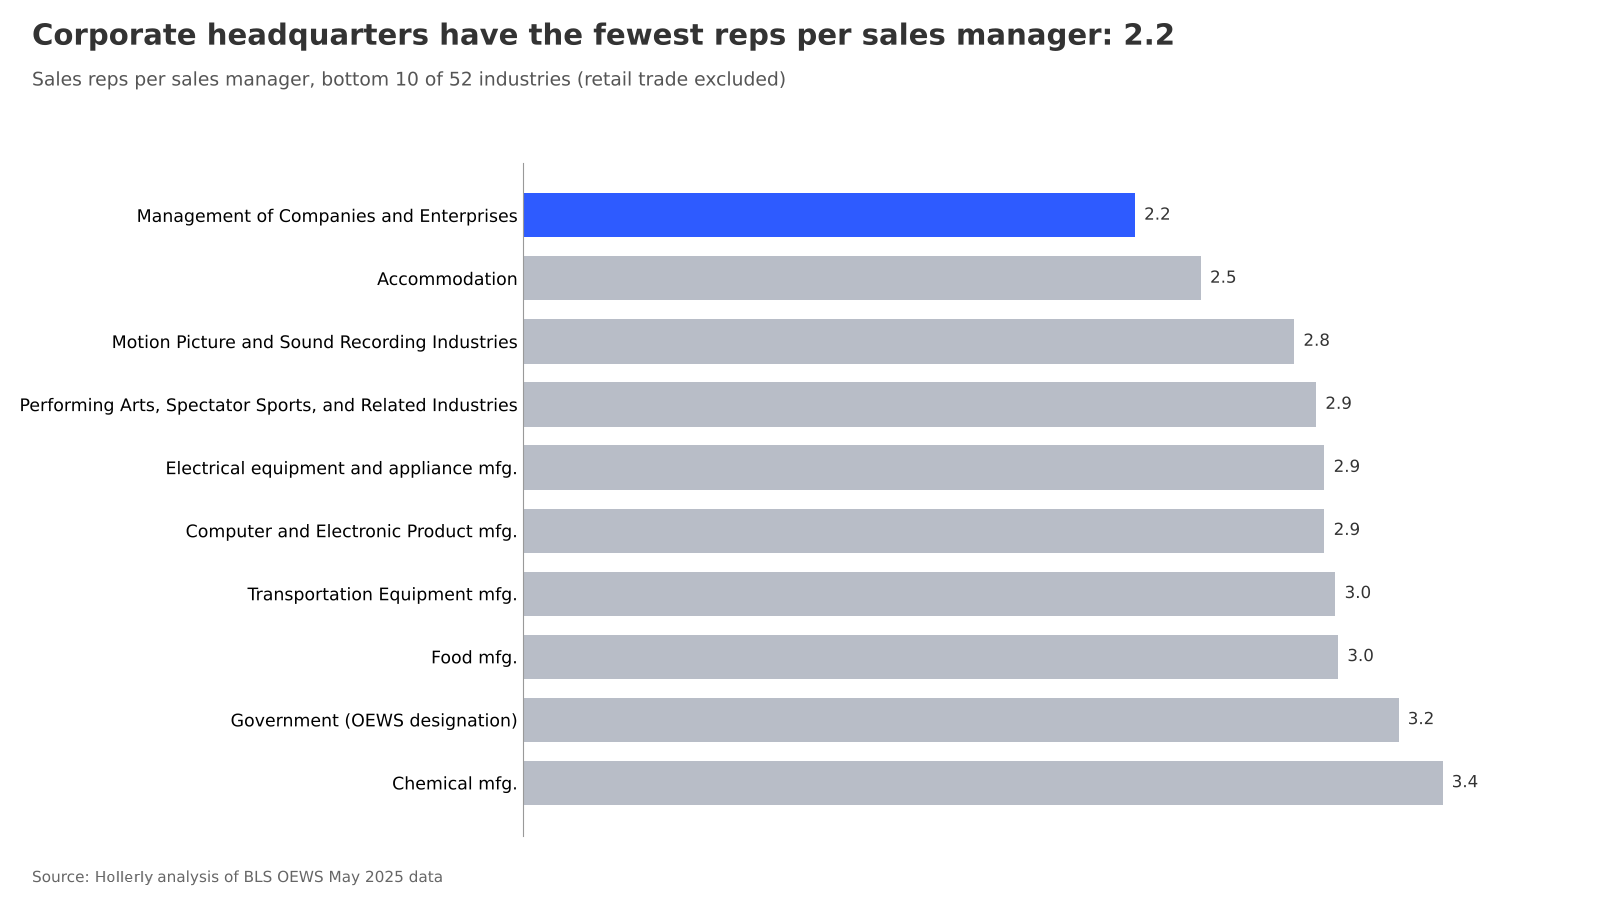
- Corporate headquarters (NAICS 551, management of companies and enterprises) have the fewest reps per sales manager among the 52 industries ranked, at 2.2.
- 7 of 52 industries have 10 or more sales reps per sales manager.
- Professional, scientific and technical services has 4.7 reps per sales manager, across 404,250 reps.
The national ratio
BLS counts 3,894,480 wage and salary workers in the two sales representative groups (services reps and wholesale and manufacturing reps) and 637,080 sales managers. That works out to 6.1 reps for every sales manager across the economy.
That figure is an occupational ratio, not a reporting line. Some sales managers run teams of account executives, others manage channel partners or a single territory, and some reps report to a VP or founder rather than a sales manager. Still, comparing the ratio across industries shows where sales organizations are flatter and where they carry more management per rep.
Where sales teams run leanest
Specialty Trade Contractors top the list at 16.6 reps per manager. The rest of the top 10 includes banks and lenders (credit intermediation), securities firms, telecommunications, waste management and printing.
| Industry | Sales reps | Sales managers | Reps per manager |
|---|---|---|---|
| Specialty Trade Contractors | 110,560 | 6,640 | 16.6 |
| Credit Intermediation and Related Activities | 298,410 | 18,670 | 16.0 |
| Waste Management and Remediation Services | 11,290 | 800 | 14.1 |
| Amusement, Gambling, and Recreation Industries | 25,320 | 2,060 | 12.3 |
| Securities, Commodity Contracts, and Other Financial Investments and Related Activities | 177,720 | 15,020 | 11.8 |
| Printing and Related Support Activities | 17,540 | 1,500 | 11.7 |
| Telecommunications | 80,710 | 7,170 | 11.3 |
| Personal and Laundry Services | 17,180 | 1,730 | 9.9 |
| Wood Product Manufacturing | 8,900 | 950 | 9.4 |
| Nonmetallic Mineral Product Manufacturing | 11,830 | 1,300 | 9.1 |
Where there is more management per rep
At the other end, corporate headquarters (management of companies and enterprises) have 2.2 reps per sales manager. 7 of the bottom 12 industries are manufacturers. In 13 of the 52 ranked industries the ratio is below 4.
| Industry | Sales reps | Sales managers | Reps per manager |
|---|---|---|---|
| Management of Companies and Enterprises | 84,140 | 37,750 | 2.2 |
| Accommodation | 24,150 | 9,770 | 2.5 |
| Motion Picture and Sound Recording Industries | 5,770 | 2,050 | 2.8 |
| Performing Arts, Spectator Sports, and Related Industries | 9,070 | 3,140 | 2.9 |
| Electrical Equipment, Appliance, and Component Manufacturing | 11,110 | 3,800 | 2.9 |
| Computer and Electronic Product Manufacturing | 29,890 | 10,250 | 2.9 |
| Transportation Equipment Manufacturing | 12,860 | 4,350 | 3.0 |
| Food Manufacturing | 16,630 | 5,590 | 3.0 |
| Federal, State, and Local Government, excluding State and Local Government Schools and Hospitals and the U.S. Postal Service (OEWS Designation) | 2,970 | 930 | 3.2 |
| Chemical Manufacturing | 21,600 | 6,450 | 3.4 |
The biggest sales employers
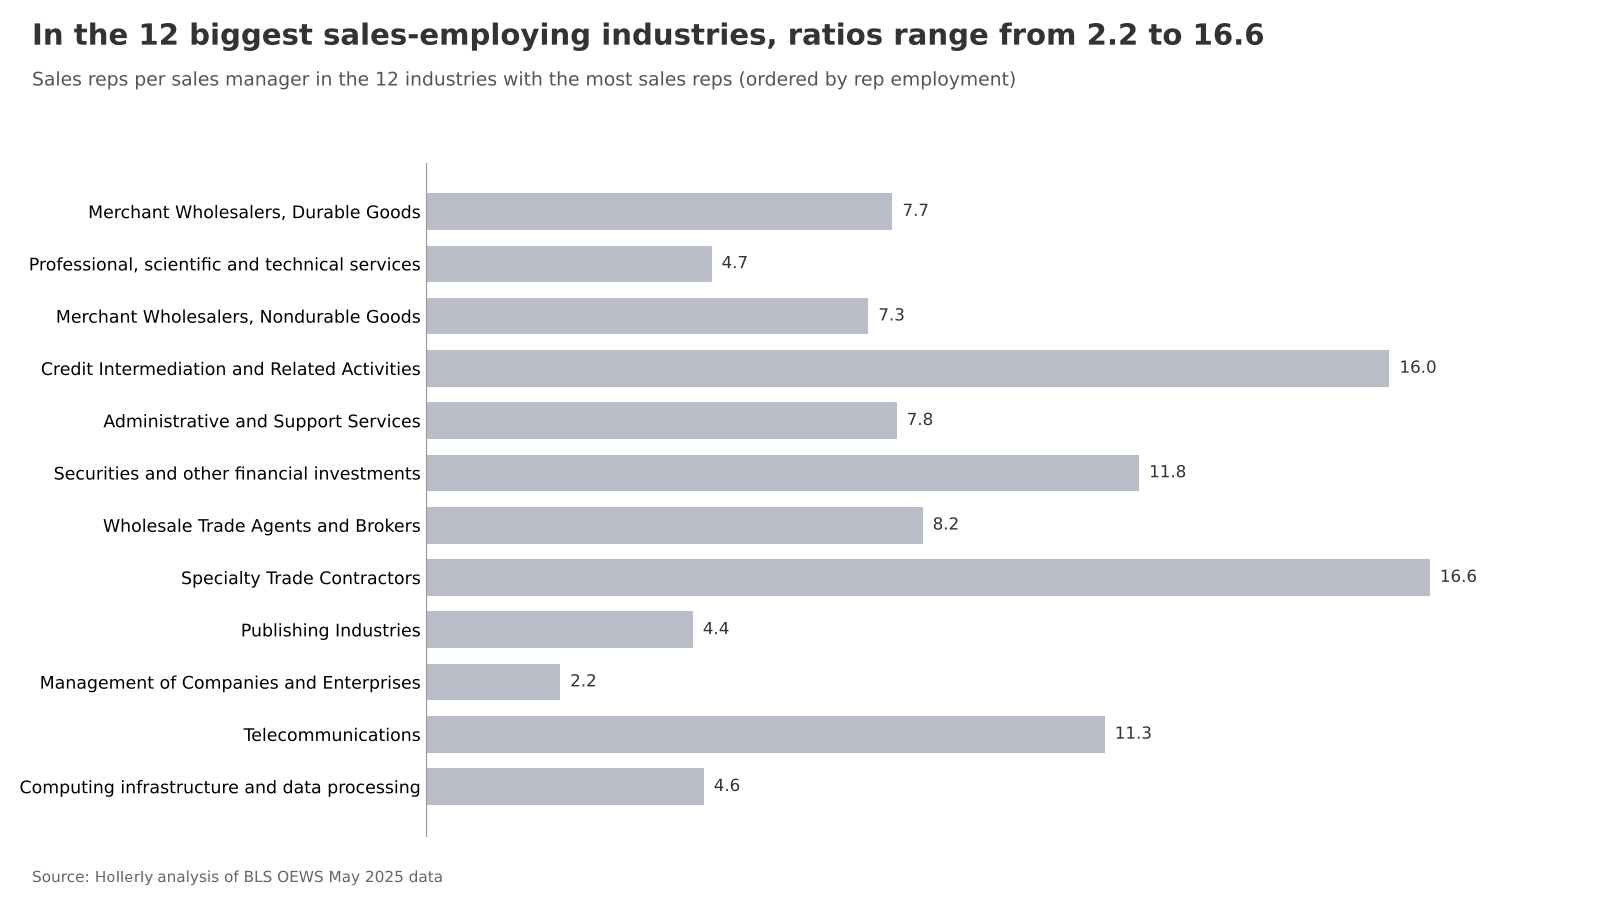
Among the 12 industries that employ the most sales reps, the ratio runs from 2.2 in management of companies and enterprises to 16.6 in specialty trade contractors.
| Industry | Sales reps | Sales managers | Reps per manager |
|---|---|---|---|
| Merchant Wholesalers, Durable Goods | 552,420 | 71,390 | 7.7 |
| Professional, Scientific, and Technical Services | 404,250 | 85,240 | 4.7 |
| Merchant Wholesalers, Nondurable Goods | 332,020 | 45,260 | 7.3 |
| Credit Intermediation and Related Activities | 298,410 | 18,670 | 16.0 |
| Administrative and Support Services | 226,000 | 28,920 | 7.8 |
| Securities, Commodity Contracts, and Other Financial Investments and Related Activities | 177,720 | 15,020 | 11.8 |
| Wholesale Trade Agents and Brokers | 135,320 | 16,420 | 8.2 |
| Specialty Trade Contractors | 110,560 | 6,640 | 16.6 |
| Publishing Industries | 92,000 | 20,760 | 4.4 |
| Management of Companies and Enterprises | 84,140 | 37,750 | 2.2 |
| Telecommunications | 80,710 | 7,170 | 11.3 |
| Computing Infrastructure Providers, Data Processing, Web Hosting, and Related Services | 39,220 | 8,500 | 4.6 |
Agencies can offer LinkedIn lead generation white label services with Hollerly's client reports, team seats and multiple LinkedIn senders.
About the data
- Source: U.S. Bureau of Labor Statistics, Occupational Employment and Wage Statistics (OEWS), May 2025, the latest release available as of 2026-10-02. National industry-specific estimates at the 3-digit NAICS level, plus national cross-industry totals.
- Definition of sales reps: the sum of two SOC minor groups. SOC 41-3000, Sales Representatives, Services (advertising sales agents, insurance sales agents, securities, commodities and financial services sales agents, travel agents, and other services sales reps), and SOC 41-4000, Sales Representatives, Wholesale and Manufacturing (technical and scientific products, and all other products). Retail salespersons, cashiers, real estate agents, sales engineers and telemarketers are not included.
- Definition of sales managers: SOC 11-2022, Sales Managers.
- Calculation: reps per manager = (41-3000 employment + 41-4000 employment) / 11-2022 employment, by industry. The median is taken across the 52 ranked industries.
- Exclusions: 32 of 84 industries are not ranked: any industry where BLS did not publish employment for one of the three groups, retail trade industries (where sales managers mainly oversee retail salespersons, who fall outside this rep definition), industries with fewer than 500 sales managers, and industries where the sales manager employment estimate had a relative standard error above 20%. For reference, the excluded retail industries show ratios between 0.5 and 8.4.
- Limitations: this is an occupational proxy for span of control, not org chart data. OEWS covers wage and salary workers only, so self-employed agents and independent reps are excluded. Insurance carriers are excluded because BLS did not publish wholesale and manufacturing rep employment for that industry.
Sources
- BLS OEWS May 2025, national industry-specific estimates: bls.gov/oes/special-requests/oesm25in4.zip
- BLS OEWS May 2025, national estimates: bls.gov/oes/special-requests/oesm25nat.zip
- OEWS data tables index: bls.gov/oes/tables.htm
Source: Hollerly, Sales manager-to-rep ratio by industry, October 2026. https://hollerlyai.com/research/sales-manager-to-rep-ratio
Charts and data are free to use under CC BY 4.0 with a link to this page. Press questions: hello@hollerlyai.com