34.7% of Sales Workers Now Do Some Work From Home on Days They Work, Up From 23.9% in 2019
How many sales workers work from home: a Hollerly analysis of the American Time Use Survey. Published October 2026.
Key findings
- On days they worked in 2025, 34.7% of US sales workers did some work at home for their main job, up from 23.9% in 2019.
- 2025 is the highest share recorded for sales workers in the 2015 to 2025 data, edging past 34.6% in 2021.
- Sales workers were more likely to work from home than the average employed person in 2025: 34.7% compared with 30.1%.
- On an average day in 2025, 3,229,000 sales workers did some work at home, compared with 2,208,000 in 2019.
- Sales workers who worked at home in 2025 spent an average of 5.07 hours working there, up from 3.77 hours in 2019.
- The share of working sales employees who went to a workplace fell from 81.5% in 2019 to 72.1% in 2025.
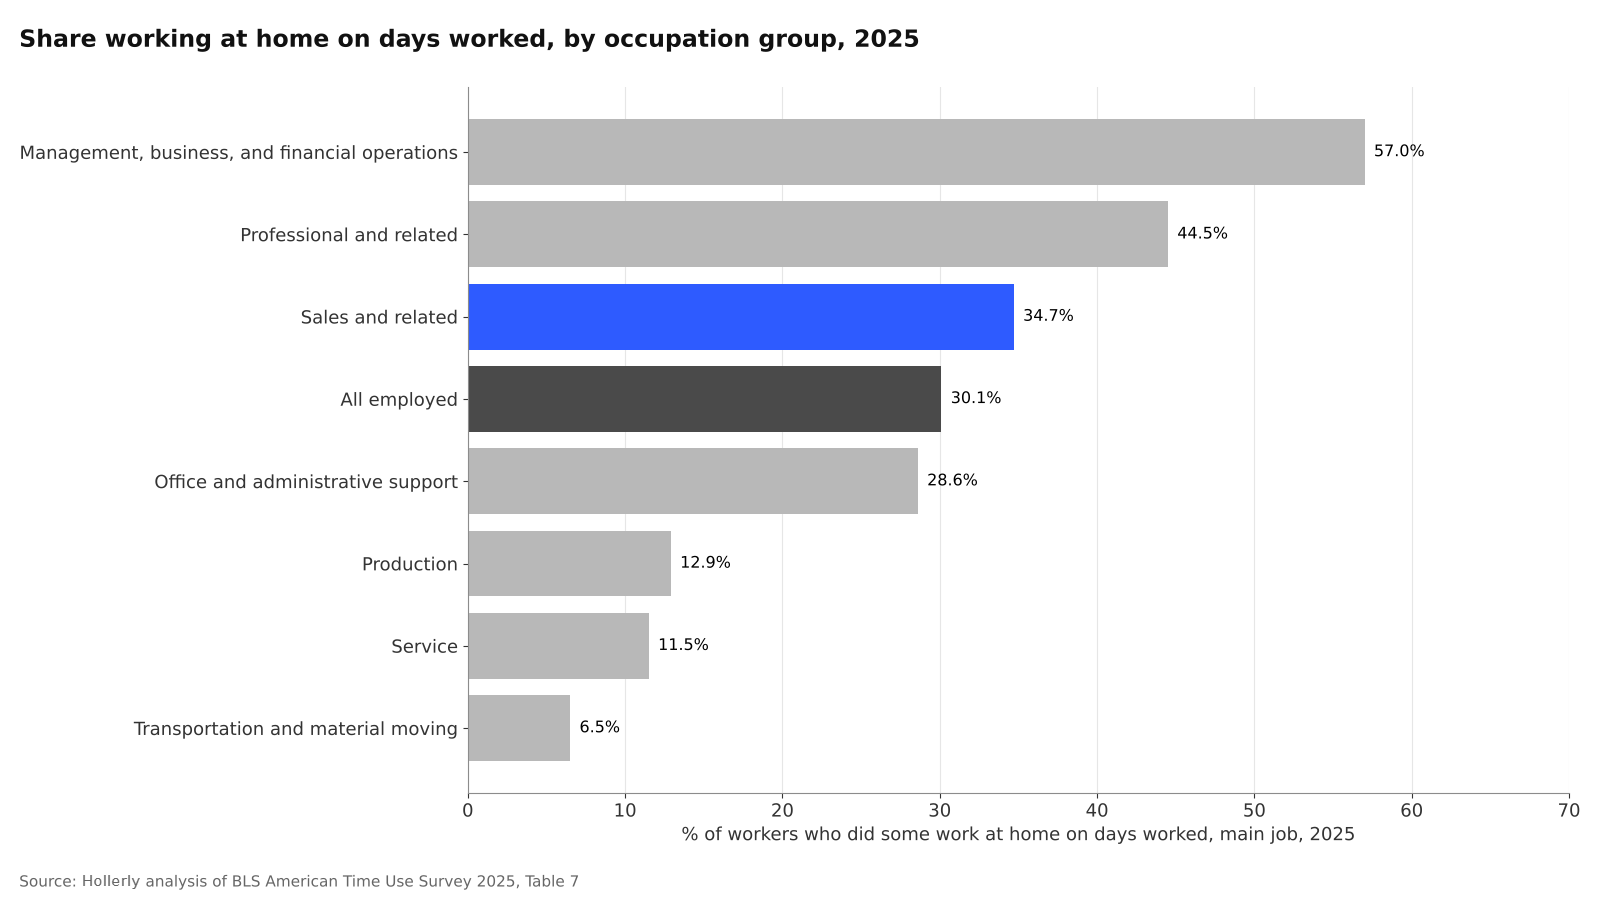
- Sales ranked 3rd of the 7 occupation groups with published 2025 estimates for working at home, behind management, business and financial (57.0%) and professional (44.5%) occupations.
A third of sales workdays now include work at home
The American Time Use Survey (ATUS) records where people do their work, hour by hour, on a single sampled day. That lets it measure how often sales workers actually work from home, including people who split a day between home and an office.
In 2025, 34.7% of people in sales and related occupations who worked on a given day did some of that work at home. In 2019, the share was 23.9%.
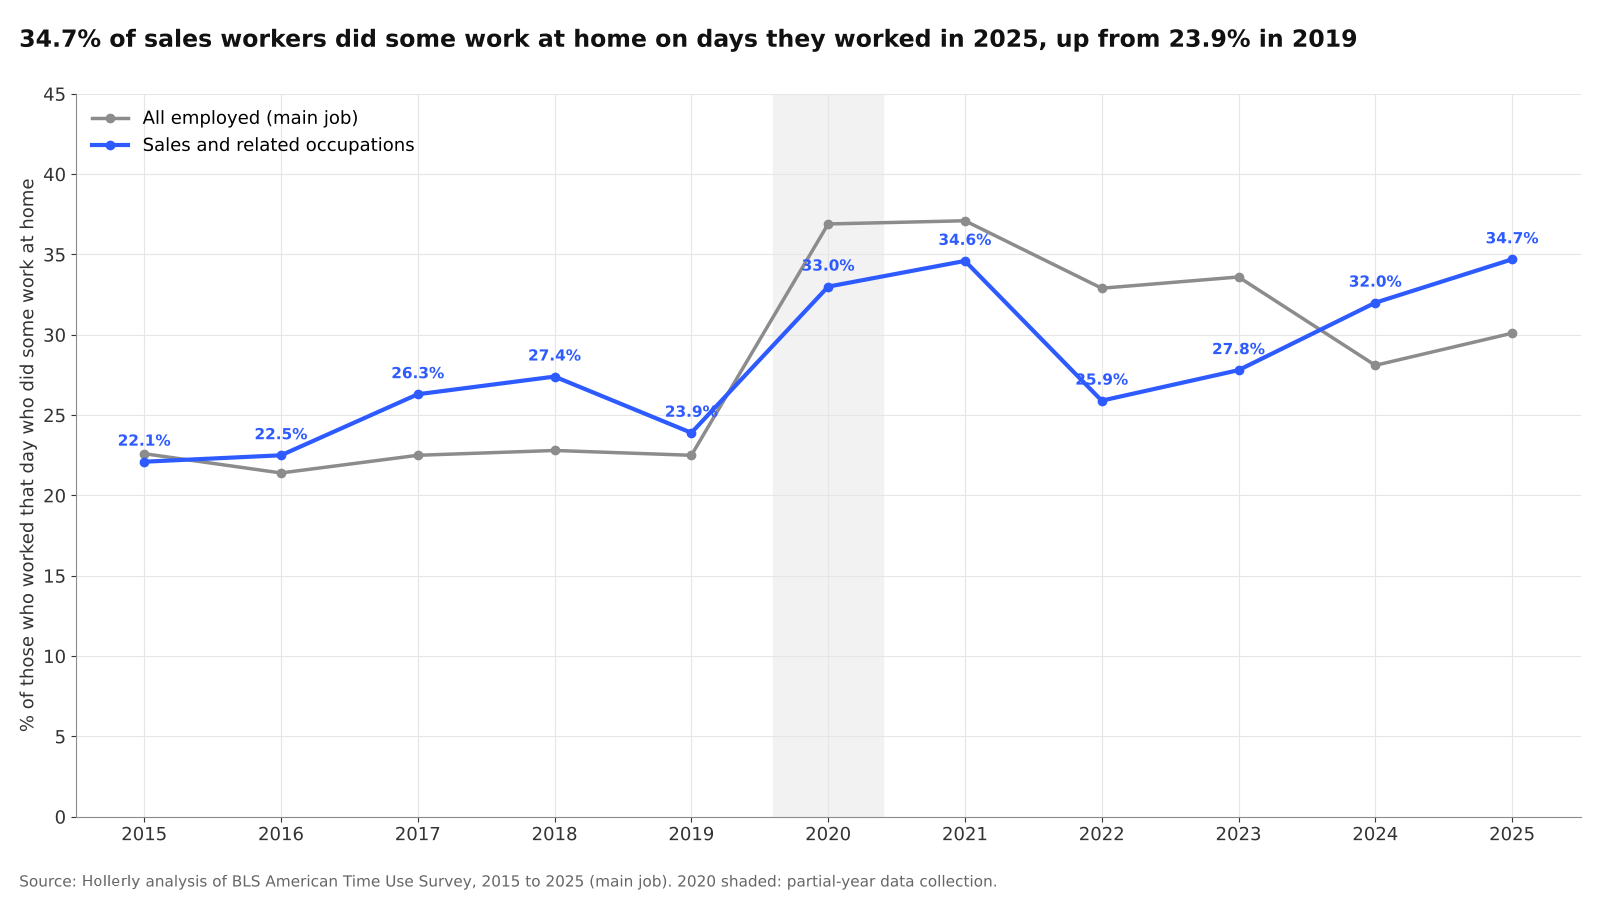
The path between those years was not a straight line. The share jumped to 34.6% in 2021, fell to 25.9% in 2022, then rose to 27.8% in 2023, 32.0% in 2024 and 34.7% in 2025. For employed people as a whole, the share went the other way after 2021, falling from 37.1% to 30.1% in 2025. Sales workers have been above the all-worker average in both 2024 and 2025.
Because single-year ATUS estimates for one occupation group carry wide sampling error, multi-year averages give a steadier comparison. Sales workers averaged 24.44% from 2015 to 2019 and 31.00% from 2021 to 2025.
| Year | Sales: % who did some work at home | All employed: % who did some work at home | Sales: avg hours worked at home |
|---|---|---|---|
| 2015 | 22.1% | 22.6% | 3.70 |
| 2019 | 23.9% | 22.5% | 3.77 |
| 2021 | 34.6% | 37.1% | 5.19 |
| 2022 | 25.9% | 32.9% | 4.75 |
| 2023 | 27.8% | 33.6% | 5.20 |
| 2024 | 32.0% | 28.1% | 5.23 |
| 2025 | 34.7% | 30.1% | 5.07 |
Home days are longer, workplace days are fewer
Sales workers who worked at home in 2025 spent 5.07 hours of the day working there, compared with 3.77 hours in 2019.
At the same time, fewer sales workers went to a workplace. In 2019, 81.5% of sales workers who worked on a given day did some of that work at their workplace. In 2025, 72.1% did. Some people do both on the same day, so the two shares add up to more than 100%.
How sales compares with other occupations
Work at home is most common in office-based jobs. In 2025, 57.0% of management, business and financial workers did some work at home on days they worked, as did 44.5% of professional workers. Sales came next at 34.7%, ahead of office and administrative support (28.6%), production (12.9%), service (11.5%) and transportation and material moving (6.5%). BLS did not publish estimates for the remaining three groups because of sample size.
What it means for sales teams
A third of sales workdays now include time at home, and those who work at home spend an average of 5.07 hours working there. For sales leaders, that makes remote prospecting, digital channels and tools that work outside the office a routine part of how the job gets done.
Hollerly's LinkedIn connection bot sends personalized connection requests at a safe daily pace, inside the working hours you set.
About the data
- Source: US Bureau of Labor Statistics, American Time Use Survey (ATUS), annual news release Table 7, "Employed persons working on main job at home, workplace, and time spent working at each location by class of worker, occupation, and earnings," data years 2015 to 2025. The 2025 results (released June 2026) are the latest available. 2020 figures come from Table 5 of the 2020 release, which covers May 10 to December 31 only.
- Measure: the percent of employed people age 15 and over who worked at their main job on a given day and did any of that work at home. Working at home includes any work done at home, not only by people whose usual workplace is their home. Days include weekdays, weekends and holidays.
- All employed figure: BLS does not print a total row in Table 7, so this figure is the average of the published wage-and-salary and self-employed rows, weighted by the number of people in each who worked on an average day. The 2020 count of sales workers working at home is derived from the published total employed and percentages.
- Occupation group: "Sales and related" is a broad Census occupation group. It includes retail salespeople and cashiers as well as B2B sales representatives and sales managers.
- Limitations: single-year ATUS estimates for one occupation group have wide sampling error. BLS suspended collection from mid-March to mid-May 2020, and 2020 figures are not directly comparable with other years. Starting with 2020 data, occupations follow the 2018 Census occupation classification, which BLS says is not strictly comparable with earlier years. Multi-year averages are simple means of the annual figures, computed by Hollerly.
Sources
- BLS ATUS 2025 results, Table 7: bls.gov/news.release/atus.t07.htm
- BLS ATUS 2024 results: bls.gov/news.release/archives/atus_06262025.htm
- BLS ATUS 2023 results: bls.gov/news.release/archives/atus_06272024.htm
- BLS ATUS 2022 results: bls.gov/news.release/archives/atus_06222023.htm
- BLS ATUS 2021 results: bls.gov/news.release/archives/atus_06232022.htm
- BLS ATUS 2020 results: bls.gov/news.release/archives/atus_07222021.htm
- BLS ATUS 2019 results: bls.gov/news.release/archives/atus_06252020.htm
- BLS ATUS 2015 to 2018 results: bls.gov/news.release/archives/atus_06242016.htm, bls.gov/news.release/archives/atus_06272017.htm, bls.gov/news.release/archives/atus_06282018.htm, bls.gov/news.release/archives/atus_06192019.htm
Source: Hollerly, How many sales workers work from home, October 2026. https://hollerlyai.com/research/sales-work-from-home
Charts and data are free to use under CC BY 4.0 with a link to this page. Press questions: hello@hollerlyai.com