Sales unemployment fell to 3.2% in September 2026, 0.8 points below the 4.0% rate for all workers
Sales Unemployment Rate vs All Workers. Published October 2026.
Hollerly analysis of monthly Current Population Survey data, January 2015 to September 2026
Key findings
- The unemployment rate for sales and related occupations was 3.2% in September 2026 (not seasonally adjusted), compared with 4.0% for all workers.
- Sales unemployment has been below the overall rate for 5 consecutive months, from May to September 2026.
- From 2015 to 2025, the annual sales unemployment rate was above the overall rate in 9 of 11 years, typically by 0.1 to 0.3 percentage points outside of 2020.
- In 2025, sales unemployment averaged 4.6%, compared with 4.3% for all workers (an 11-month average, since October 2025 data were not collected).
- Sales unemployment peaked at 17.1% in April 2020, compared with 14.4% for all workers that month.
- Over January to September 2026, unemployment averaged 5.0% for women in sales occupations and 3.6% for men.
Sales jobs track the wider labor market closely
Unemployment among people whose last job was in a sales occupation moves almost in step with the national rate. Outside of 2020, the monthly gap between the two never exceeded one percentage point between January 2015 and September 2026.
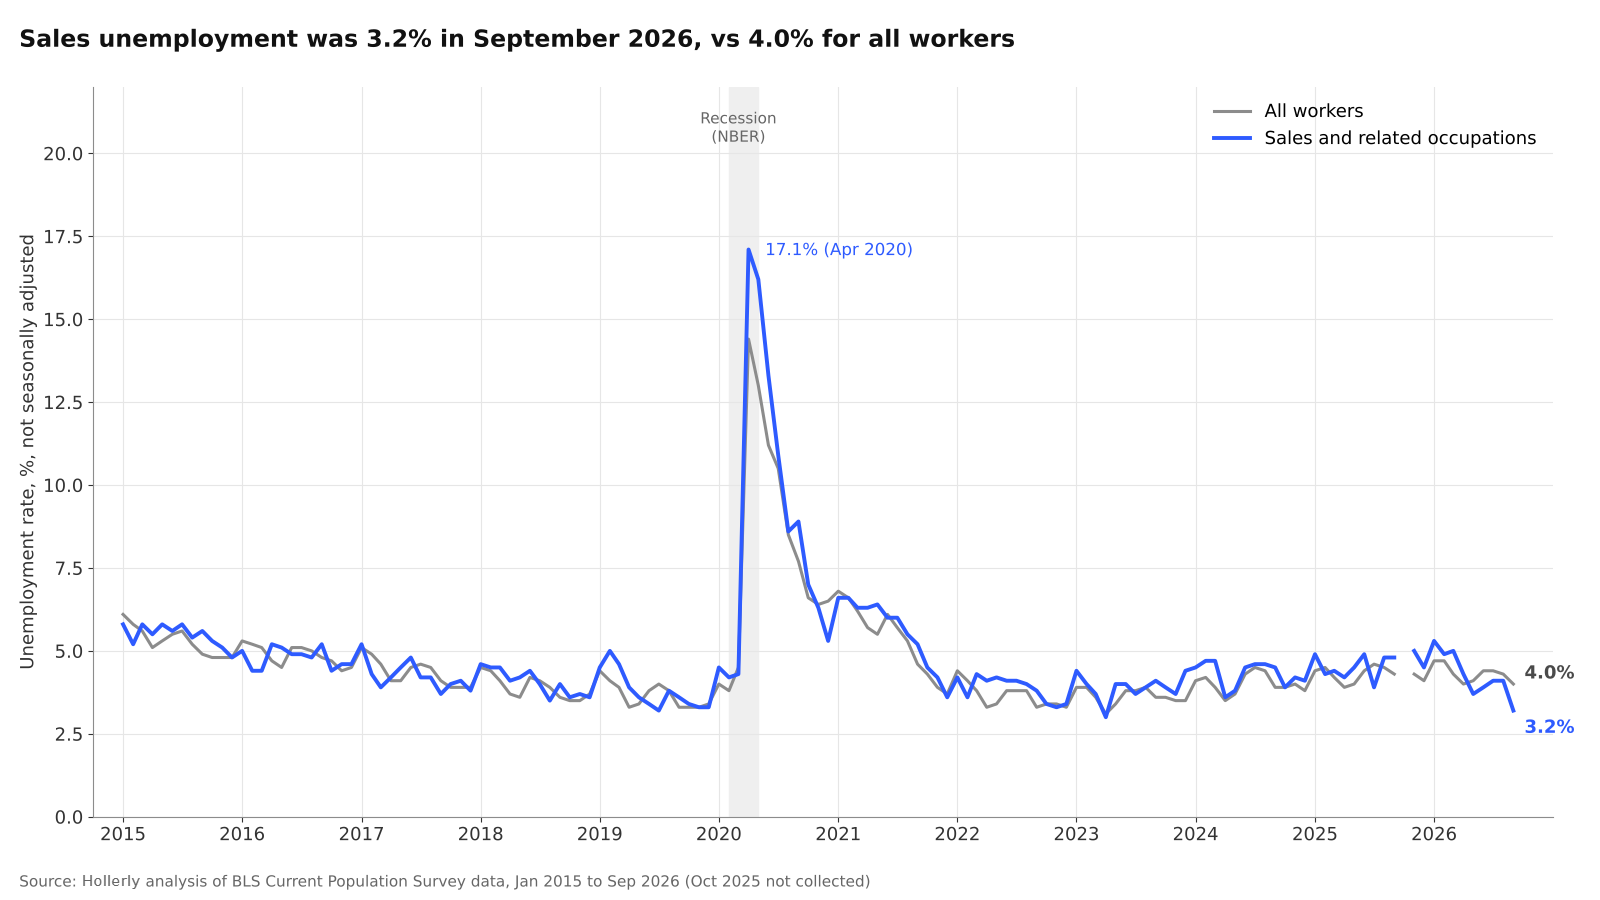
The biggest divergence came in spring 2020. Sales unemployment jumped to 17.1% in April 2020, 2.7 points above the 14.4% overall rate, as store closures hit retail sales jobs, which make up a large part of the BLS sales group. By 2022 the annual sales rate was back to 3.9%.
A small but steady premium, until 2026
In most years the annual sales rate sits a few tenths of a point above the national figure. Sales was above the overall rate in 9 of the 11 years from 2015 through 2025, with the gap at +0.3 points in 2025.
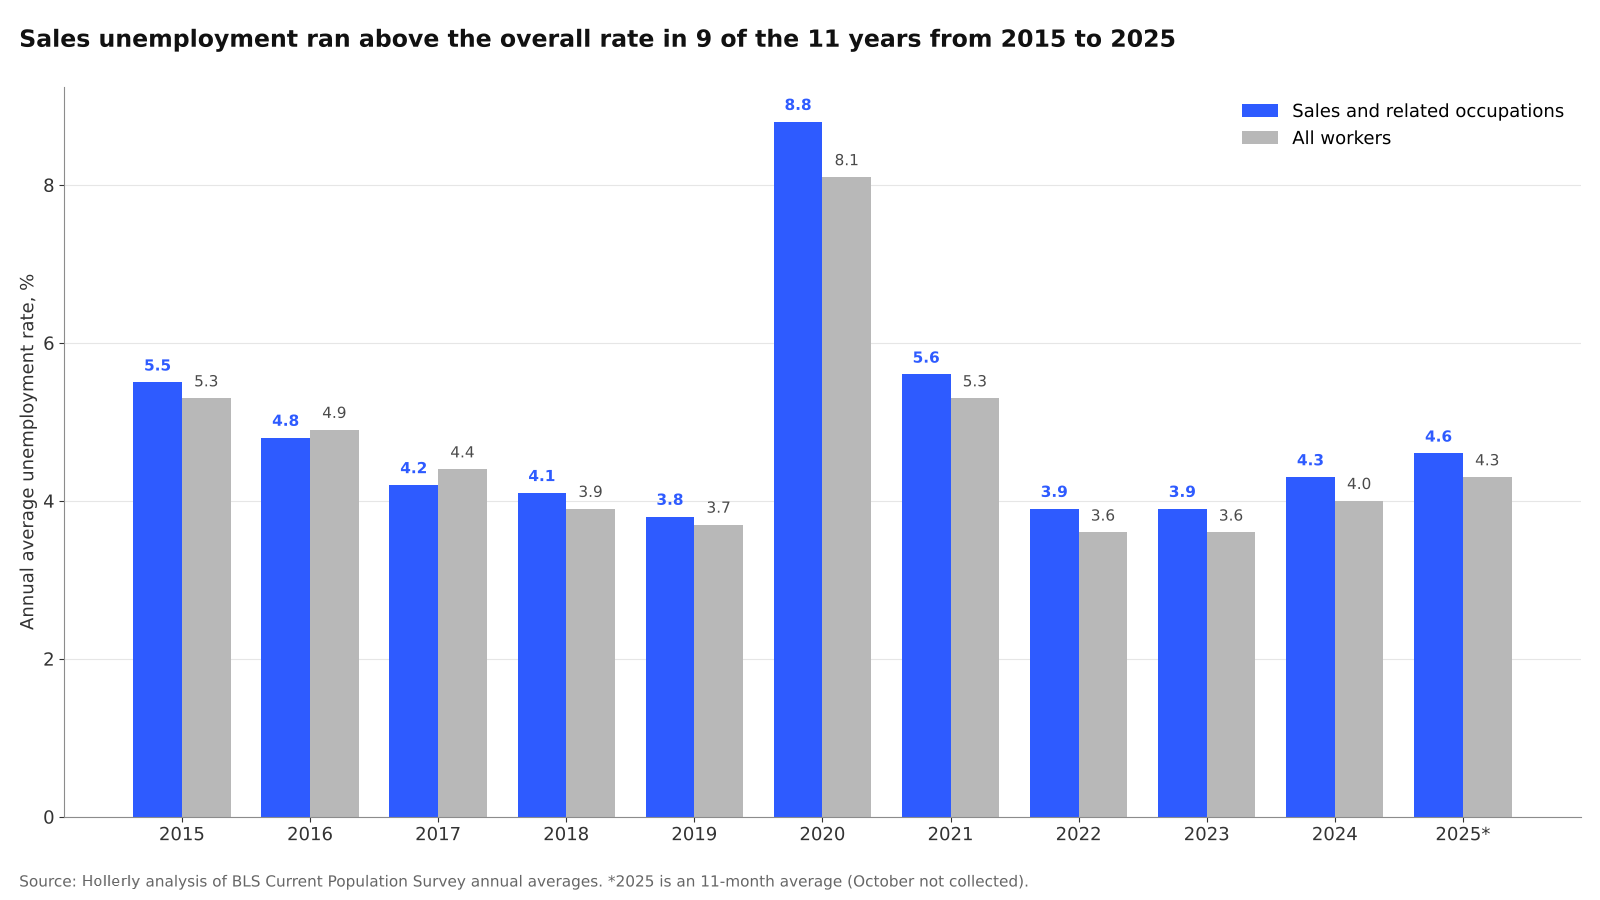
| Year | Sales and related | All workers | Gap (pts) |
|---|---|---|---|
| 2015 | 5.5% | 5.3% | +0.2 |
| 2016 | 4.8% | 4.9% | -0.1 |
| 2017 | 4.2% | 4.4% | -0.2 |
| 2018 | 4.1% | 3.9% | +0.2 |
| 2019 | 3.8% | 3.7% | +0.1 |
| 2020 | 8.8% | 8.1% | +0.7 |
| 2021 | 5.6% | 5.3% | +0.3 |
| 2022 | 3.9% | 3.6% | +0.3 |
| 2023 | 3.9% | 3.6% | +0.3 |
| 2024 | 4.3% | 4.0% | +0.3 |
| 2025* | 4.6% | 4.3% | +0.3 |
\*2025 annual averages exclude October, when CPS data were not collected.
That pattern has reversed in recent months. Sales unemployment has been below the overall rate every month since May 2026, reaching 3.2% in September 2026 compared with 4.0% overall. Across January to September 2026, the sales rate averaged 4.3%, down from 4.5% in the same months of 2025, while the overall rate averaged 4.3% in both periods.
Monthly occupation rates are not seasonally adjusted and come from a sample survey, so a few months of movement should be read as a signal to watch rather than a settled trend.
Context from other occupation groups
For January to September 2026, average unemployment was 2.5% in management, business and financial operations occupations, 3.8% in office and administrative support and 5.3% in service occupations. Sales sits near the middle of that range, at 4.3%.
Within sales, the rate for women (5.0%) has been higher than for men (3.6%) over the same period.
Agencies can offer LinkedIn lead generation white label services with Hollerly's client reports, team seats and multiple LinkedIn senders.
About the data
- Source: U.S. Bureau of Labor Statistics, Current Population Survey (CPS), monthly unemployment rates.
- Series: LNU04032220 (unemployment rate, sales and related occupations), LNU04000000 (unemployment rate, all workers), LNU04034054 and LNU04034083 (sales and related, men and women), plus LNU04032216, LNU04032221 and LNU04032218 for comparison groups. All series are not seasonally adjusted.
- Period: Monthly, January 2015 to September 2026 (latest available). Annual figures are BLS-published annual averages. January to September averages are simple means of the published monthly rates, computed by Hollerly.
- Gaps: October 2025 CPS data were not collected because of the federal government shutdown. BLS 2025 annual averages are 11-month averages. January 2026 estimates reflect updated population controls.
- Limitations: Occupation rates classify unemployed people by their last job, so they exclude new entrants with no work history, while the overall rate includes them. The BLS sales group spans retail cashiers and counter clerks as well as B2B sales representatives and is dominated in headcount by retail roles. Monthly occupation estimates have wider sampling error than the national rate. The recession shading uses NBER dates (February to April 2020).
Sources
- BLS Current Population Survey: bls.gov/cps/
- BLS LN series catalog: download.bls.gov/pub/time.series/ln/ln.series
- BLS CPS documentation: bls.gov/cps/documentation.htm
- NBER business cycle dates: nber.org/research/data/us-business-cycle-expansions-and-contractions
Source: Hollerly, Sales Unemployment Rate vs All Workers, October 2026. https://hollerlyai.com/research/sales-unemployment-rate
Charts and data are free to use under CC BY 4.0 with a link to this page. Press questions: hello@hollerlyai.com